
Videos
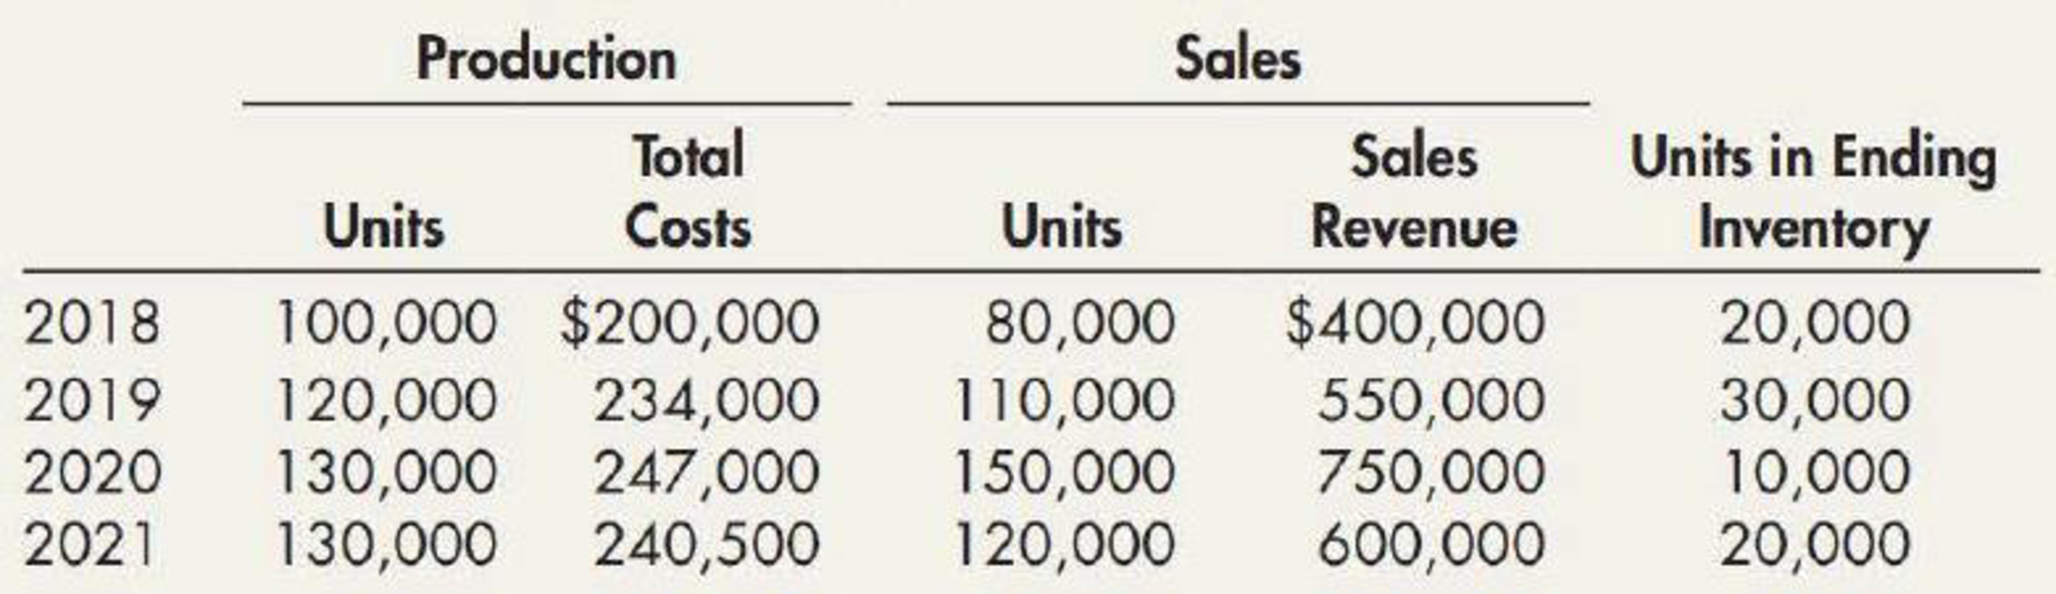
Habicht Company was formed in 2018 to produce a single product. The production and sales for the next 4 years were as follows:
Required:
- 1. Determine the gross profit for each year under each of the following periodic inventory methods:
- a. FIFO
- b. LIFO
- c. Average cost (Round unit costs to 3 decimal places.)
- 2. Next Level Explain whether the company’s return on assets (net income divided by average total assets) would be higher under FIFO or LIFO.
1.
Ascertain the gross profit under the periodic inventory system for each year as per the inventory cashflow methods.
Explanation of Solution
First-in-First-Out (FIFO): In this method, items purchased initially are sold first. So, the value of the ending inventory consists the recent cost for the remaining unsold items.
Last-in-First-Out (LIFO): In this method, items purchased recently are sold first. So, the value of the ending inventory consists the initial cost for the remaining unsold items.
- a) Calculate the gross profit for the four years under FIFO method:
| Particulars | 2018 | 2019 | 2020 | 2021 |
| Amount ($) | Amount ($) | Amount ($) | Amount ($) | |
| Net sales | $400,000 | $550,000 | $750,000 | $600,000 |
| Cost of goods sold | ||||
| Beginning inventory | $ 0 | $ 40,000 | $ 58,500 | $ 19,000 |
| Add: Production | $ 200,000 | $ 234,000 | $ 247,000 | $ 240,500 |
| Goods available for sale | $ 200,000 | $ 274,000 | $ 305,500 | $ 259,500 |
| Less: Ending inventory | (1) $ 40,000 | (2) $ 58,500 | (3) $ 19,000 | (4) $ 37,000 |
| Cost of goods sold | $ 160,000 | $ 215,500 | $ 286,500 | $ 222,500 |
| Gross Margin | $ 240,000 | $ 334,500 | $ 463,500 | $ 377,500 |
Table (1)
Working Note (1):
Ending inventory for 2018 is $40,000
Working Note (2):
Ending inventory for 2019 is $58,500
Working Note (3):
Ending inventory for 2020 is $19,000
Working Note (4):
Ending inventory for 2021 is $37,000
- b) Calculate the gross profit for the four years under LIFO method:
| Particulars | 2018 | 2019 | 2020 | 2021 |
| Amount ($) | Amount ($) | Amount ($) | Amount ($) | |
| Net sales | $400,000 | $550,000 | $750,000 | $600,000 |
| Cost of goods sold | ||||
| Beginning inventory | $ 0 | $ 40,000 | $ 59,500 | $ 20,000 |
| Add: Production | $ 200,000 | $ 234,000 | $ 247,000 | $ 240,500 |
| Goods available for sale | $ 200,000 | $ 274,000 | $ 306,500 | $ 260,500 |
| Less: Ending inventory | (5) $ 40,000 | (6) $ 59,500 | (7) $ 20,000 | (8) $ 38,500 |
| Cost of goods sold | $ 160,000 | $ 214,500 | $ 286,500 | $ 222,000 |
| Gross Margin | $ 240,000 | $ 335,500 | $ 463,500 | $ 378,000 |
Table (2)
Working Note (5):
Ending inventory for 2018 is $40,000
Working Note (6):
Ending inventory for 2019 is $59,500
Working Note (7):
Ending inventory for 2020 is $20,000
Working Note (8):
Ending inventory for 2021 is $38,500
- a) Calculate the gross profit for the four years under Average cost method:
Compute the cost of goods sold for average cost method:
| Year | Beginning inventory | Production | Goods available for sale | Average Unit | |||
| Units | Cost | Units | Cost | Units | Cost | Cost | |
| 2018 | 0 | $ 0 | 100,000 | $ 200,000 | 100,000 | $ 200,000 | $ 2.00 |
| 2019 | 20,000 | $ 40,000 | 120,000 | $ 234,000 | 140,000 | $ 274,000 | $ 1.957 |
| 2020 | 30,000 | $ 58,710 | 130,000 | $ 247,000 | 160,000 | $ 305,710 | $ 1.911 |
| 2021 | 10,000 | $ 19,110 | 130,000 | $ 240,500 | 140,000 | $ 259,610 | $ 1.854 |
Table (3)
| Year | Ending inventory | Cost of goods sold | ||
| Units | Cost | Units | Cost | |
| 2018 | 20,000 | $ 40,000 | 80,000 | $ 160,000 |
| 2019 | 30,000 | $ 58,710 | 110,000 | $ 215,290 |
| 2020 | 10,000 | $ 19,110 | 150,000 | $ 286,600 |
| 2021 | 20,000 | $ 37,080 | 120,000 | $ 222,530 |
Table (4)
Calculate the gross profit for the four years under Average cost method
| Particulars | 2018 | 2019 | 2020 | 2021 |
| Amount ($) | Amount ($) | Amount ($) | Amount ($) | |
| Net sales | $400,000 | $550,000 | $750,000 | $600,000 |
| Cost of goods sold | ||||
| Beginning inventory | $ 0 | $ 40,000 | $ 58,710 | $ 19,110 |
| Add: Production | $ 200,000 | $ 234,000 | $ 247,000 | $ 240,500 |
| Goods available for sale | $ 200,000 | $ 274,000 | $ 305,710 | $ 259,610 |
| Less: Ending inventory | $ 40,000 | $ 58,710 | $ 19,110 | $ 37,080 |
| Cost of goods sold | $ 160,000 | $ 215,290 | $ 286,600 | $ 222,530 |
| Gross Margin | $ 240,000 | $ 334,710 | $ 463,400 | $ 377,470 |
Table (5)
2.
Identify would return on asset would be greater under FIFO and LIFO.
Explanation of Solution
The net income and assets are higher under the FIFO method. There is a difference in the net income under both the methods.
Want to see more full solutions like this?
Chapter 7 Solutions
Intermediate Accounting: Reporting And Analysis


- Assume your company uses the periodic inventory costing method, and the inventory count left out an entire warehouse of goods that were in stock at the end of the year, with a cost value of $222,000. How will this affect your net income in the current year? How will it affect next years net income?arrow_forwardCuneo Companys income statements for the last 3 years are as follows: Refer to the information for Cuneo Company above. Required: 1. Prepare a common-size income statement for Year 1 by expressing each line item as a percentage of sales revenue. (Note: Round percentages to the nearest tenth of a percent.) 2. Prepare a common-size income statement for Year 2 by expressing each line item as a percentage of sales revenue. (Note: Round percentages to the nearest tenth of a percent.) 3. Prepare a common-size income statement for Year 3 by expressing each line item as a percentage of sales revenue. (Note: Round percentages to the nearest tenth of a percent.)arrow_forwardSundahl Companys income statements for the past 2 years are as follows: Refer to the information for Sundahl Company above. Required: 1. Prepare a common-size income statement for Year 1 by expressing each line item as a percentage of sales revenue. (Note: Round percentages to the nearest tenth of a percent.) 2. Prepare a common-size income statement for Year 2 by expressing each line item as a percentage of sales revenue. (Note: Round percentages to the nearest tenth of a percent.)arrow_forward
- Fava Company began operations in 2018 and used the LIFO inventory method for both financial reporting and income taxes. At the beginning of 2019, the anticipated cost trends in the industry had changed, so that it adopted the FIFO method for both financial reporting and income taxes. Fava reported revenues of 300,000 and 270,000 in 2019 and 2018, respectively. Fava reported expenses (excluding income tax expense) of 125,000 and 120,000 in 2019 and 2018, which included cost of goods sold of 55,000 and 45,000, respectively. An analysis indicates that the FIFO cost of goods sold would have been lower by 8,000 in 2018. The tax rate is 21%. Fava has a simple capital structure with 15,000 shares of common stock outstanding during 2018 and 2019. It paid no dividends in either year. Required: 1. Prepare the journal entry to reflect the change. 2. At the end of 2019, prepare the comparative income statements for 2019 and 2018. Notes to the financial statements are not necessary. 3. At the end of 2019, prepare the comparative retained earnings statements for 2019 and 2018.arrow_forwardLast year, Nikkola Company had net sales of 2,299,500,000 and cost of goods sold of 1,755,000,000. Nikkola had the following balances: Refer to the information for Nikkola Company above. Required: Note: Round answers to one decimal place. 1. Calculate the average inventory. 2. Calculate the inventory turnover ratio. 3. Calculate the inventory turnover in days. 4. CONCEPTUAL CONNECTION Based on these ratios, does Nikkola appear to be performing well or poorly?arrow_forwardCuneo Companys income statements for the last 3 years are as follows: Refer to the information for Cuneo Company above. Required: 1. Prepare a common-size income statement for Year 2 by expressing each line item for Year 2 as a percentage of that same line item from Year 1. (Note: Round percentages to the nearest tenth of a percent.) 2. Prepare a common-size income statement for Year 3 by expressing each line item for Year 3 as a percentage of that same line item from Year 1. (Note: Round percentages to the nearest tenth of a percent.)arrow_forward
- When the double-extension approach to the dollar-value LIFO inventory cost flow method is used, the inventory layer added in the current year is multiplied by an index number. How would the following be used in the calculation of this index number?arrow_forwardOlson Company adopted the dollar-value LIFO method for inventory valuation at the beginning of 2015. The following information about the inventory at the end of each year is available from Olsons records: Required: 1. Calculate the dollar-value LIFO inventory at the end of each year. 2. Prepare the appropriate disclosures for the 2021 annual report if Olson uses current cost internally and LIFO for financial reporting.arrow_forwardJC Penney Company uses LIFO in applying the lower-of-cost-or-market. Recent financial state-ments were used to compile the following information (dollar figures in millions): Average inventory (throughout the year) . . . . . . . . . . . . . . . . . . . . . . . . . . . . . . . . . . . $ 3,142Current assets (at year-end) . . . . . . . . . . . . . . . . . . . . . . . . . . . . . . . . . . . . . . . . . . . . 6,652Current liabilities (at year-end) . . . . . . . . . . . . . . . . . . . . . . . . . . . . . . . . . . . . . . . . . . . 3,249Net sales . . . . . . . . . . . . . . . . . . . . . . . . . . . . . . . . . . . . . . . . . . . . . . . . . . . . . . . . . . . 17,556Cost of goods sold . . . . . . . . . . . . . . . . . . . . . . . . . . . . . . . . . . . . . . . . . . . . . . . . . . . . 10,646Gross profit . . . . . . . . . . . . . . . . . . . . . . . . . . . . . . . . . . . . . . . . . . . . . . . . . . . . . . . . . 6,910Average time required to collect outstanding receivables…arrow_forward
- The following data were extracted from the income statement of Keever Inc.: Current Year Previous Year Sales $1,095,000 $1,143,200 Beginning inventories 60,050 52,050 Cost of goods sold 547,500 635,100 Ending inventories 54,250 60,050 a. Determine for each year (1) the inventory turnover and (2) the number of days' sales in inventory. Round interim calculations to the nearest dollar and the final answers to one decimal place. Assume 365 days a year. Current Year Previous Year 1. Inventory turnover fill in the blank 1 fill in the blank 2 2. Number of days' sales in inventory fill in the blank 3 days fill in the blank 4 daysarrow_forwardThe condensed financial statements of Blossom Company for the years 2019 and 2020 are presented below. BLOSSOM COMPANY Balance Sheets December 31 (in thousands) 2020 2019 Current assets Cash and cash equivalents $330 $360 Accounts receivable (net) 630 560 Inventory 580 510 Prepaid expenses 130 160 Total current assets 1,670 1590 Property, plant, and equipment (net) 410 380 Investments 170 170 530 510 Intangibles and other assets $2,780 $2,650 Total assets $980 $950 Current liabilities Long-term liabilities 600 500 Stockholders' equity-common 1,200 1,200 Total liabilities and stockholders equity $2780 $2,650 BLOSSOM COMPANY Income Statements For the Year Ended December 31 (in thousands) 2019 2020 $3,920 $3,580 Sales revenue Costs and expenses Cost of goods sold 1,130 1050 Selling & administrative expenses 2400 2,330 Interest expense 10 20 Total costs and expenses 3,540 3400 Income before income taxes 380 180 Income tax expense 152 72 $228 $108 Net incomearrow_forwardShelcal, Inc. provides the following data for the year 2019: Net Sales Revenue, $437,690; Cost of Goods Sold, $255,000. O The gross profit as a percentage of net sales is (Round your answer to two decimal places.) OA) 37.96% OB) 39.80% OC) 60.20% OD) 40.8%arrow_forward
- Intermediate Accounting: Reporting And AnalysisAccountingISBN:9781337788281Author:James M. Wahlen, Jefferson P. Jones, Donald PagachPublisher:Cengage Learning
 Principles of Accounting Volume 1AccountingISBN:9781947172685Author:OpenStaxPublisher:OpenStax College
 Managerial Accounting: The Cornerstone of Busines...AccountingISBN:9781337115773Author:Maryanne M. Mowen, Don R. Hansen, Dan L. HeitgerPublisher:Cengage Learning
  Financial Reporting, Financial Statement Analysis...FinanceISBN:9781285190907Author:James M. Wahlen, Stephen P. Baginski, Mark BradshawPublisher:Cengage Learning