Videos
To plot: The data on graph.
Answer to Problem 75E
Explanation of Solution
Given:The table shows the numbers
Let n represents the number of years, with
Difference is not constant and increasing order. It would be linear regression model.
Using linear regression calculator, the linear model is
To compare: The model of graphing data with model in part (a)
Answer to Problem 75E
Slope of best fit is bigger than graphing utility.
Explanation of Solution
Given: The table shows the numbers
Let n represents the number of years, with
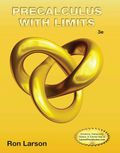
Using graphing utility to draw the graph of given table.Graph shown as below.
Now compare the models.
Slope of line using graphing utility = 7
Slope of line using linear regression = 7.75
Slope of linear regression is bigger than graphing utility.
To compare: The value of both model in year 2016.
Explanation of Solution
Given: The table shows the numbers
Year 2016 shows,
Put n=16 in both models.
Model in part (a),
Model in part (b),
Number of residents in 2016 shows more in model of part (a) as compare to part (b)
Chapter 9 Solutions
EBK PRECALCULUS W/LIMITS


 Calculus: Early TranscendentalsCalculusISBN:9781285741550Author:James StewartPublisher:Cengage Learning
 Thomas' Calculus (14th Edition)CalculusISBN:9780134438986Author:Joel R. Hass, Christopher E. Heil, Maurice D. WeirPublisher:PEARSON
 Calculus: Early Transcendentals (3rd Edition)CalculusISBN:9780134763644Author:William L. Briggs, Lyle Cochran, Bernard Gillett, Eric SchulzPublisher:PEARSON
 Calculus: Early TranscendentalsCalculusISBN:9781319050740Author:Jon Rogawski, Colin Adams, Robert FranzosaPublisher:W. H. Freeman
 Calculus: Early Transcendental FunctionsCalculusISBN:9781337552516Author:Ron Larson, Bruce H. EdwardsPublisher:Cengage Learning