Concept explainers
Videos
a.
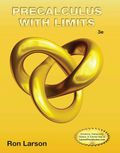
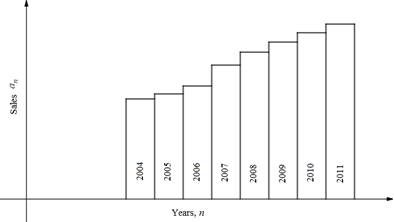
To construct: The bar graph showing the annual sales from 2004 through 2011.
a.
Answer to Problem 85E
Explanation of Solution
Given: The table shows the sales
Now, draw the bar graph of sales
Where, sales,
Sales shows height of bar graph.

b.
To find: An arithmetic sequence of the annual sales from 2004 through 2011.
b.
Answer to Problem 85E
Explanation of Solution
Given: The table shows the sales
Let
Since
The data of the table is in arithmetic sequence. The common difference,
The models which shows table data.
c.
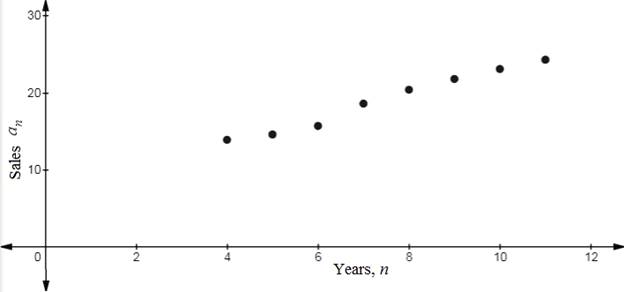
To graph: The table data.
c.
Answer to Problem 85E
Explanation of Solution
Given: The table shows the sales
Let
The given is
The
Now, draw the graph of
Where,

d.
To find: The sum of total sales from 2004 through 2011.
d.
Answer to Problem 85E
152.4 billion dollars
Explanation of Solution
Given: The table shows the sales
Let
The given is
The
The total sum,
Total sales,
Hence, the total sales 152.4 billion dollars in 8 years.
Chapter 9 Solutions
EBK PRECALCULUS W/LIMITS


 Calculus: Early TranscendentalsCalculusISBN:9781285741550Author:James StewartPublisher:Cengage Learning
 Thomas' Calculus (14th Edition)CalculusISBN:9780134438986Author:Joel R. Hass, Christopher E. Heil, Maurice D. WeirPublisher:PEARSON
 Calculus: Early Transcendentals (3rd Edition)CalculusISBN:9780134763644Author:William L. Briggs, Lyle Cochran, Bernard Gillett, Eric SchulzPublisher:PEARSON
 Calculus: Early TranscendentalsCalculusISBN:9781319050740Author:Jon Rogawski, Colin Adams, Robert FranzosaPublisher:W. H. Freeman
 Calculus: Early Transcendental FunctionsCalculusISBN:9781337552516Author:Ron Larson, Bruce H. EdwardsPublisher:Cengage Learning