
Elementary Statistics: Picturing the World (7th Edition)
7th Edition
ISBN: 9780134683416
Author: Ron Larson, Betsy Farber
Publisher: PEARSON
expand_more
expand_more
format_list_bulleted
Videos
Textbook Question
Chapter 9.3, Problem 17E
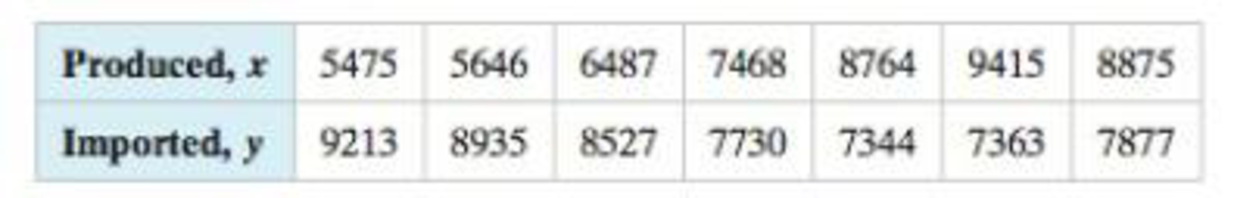
Finding the Coefficient of Determination and the Standard Error of Estimate In Exercises 11–20, use the data to (a) find the coefficient of determination r and interpret the result, and (b) find the standard error of estimate se, and interpret the result.
17. Crude Oil The table shows the amounts of crude oil (in thousands of barrels per day) produced by the United States and the amounts of crude oil (in thousands of barrels per day) imported by the United States for seven years. The equation of the regression line is ŷ = –0.438x + 11,404.947. (Source: U.S. Energy Information Administration)
Expert Solution & Answer
Want to see the full answer?
Check out a sample textbook solution
Chapter 9 Solutions
Elementary Statistics: Picturing the World (7th Edition)
Ch. 9.1 - A director of alumni affairs at a small college...Ch. 9.1 - A researcher conducts a study to determine whether...Ch. 9.1 - Consider the data on page 469 on the salaries and...Ch. 9.1 - Calculate the correlation coefficient for the...Ch. 9.1 - Use technology to calculate the correlation...Ch. 9.1 - In Try It Yourself 4, you calculated the...Ch. 9.1 - In Try It Yourself 5, you calculated the...Ch. 9.1 - Two variables have a positive linear correlation....Ch. 9.1 - Describe the range of values for the correlation...Ch. 9.1 - What does the sample correlation coefficient r...
Ch. 9.1 - Give examples of two variables that have perfect...Ch. 9.1 - Explain how to determine whether a sample...Ch. 9.1 - Discuss the difference between r and p.Ch. 9.1 - What are the null and alternate hypotheses for a...Ch. 9.1 - In your own words, what does it mean to say...Ch. 9.1 - Graphical Analysis In Exercises 912, determine...Ch. 9.1 - Graphical Analysis In Exercises 912, determine...Ch. 9.1 - Graphical Analysis In Exercises 912, determine...Ch. 9.1 - Graphical Analysis In Exercises 912, determine...Ch. 9.1 - In Exercises 13 and 14, identify the explanatory...Ch. 9.1 - In Exercises 13 and 14, identify the explanatory...Ch. 9.1 - Graphical Analysis In Exercises 1518, the scatter...Ch. 9.1 - Graphical Analysis In Exercises 1518, the scatter...Ch. 9.1 - Graphical Analysis In Exercises 1518, the scatter...Ch. 9.1 - Graphical Analysis In Exercises 1518, the scatter...Ch. 9.1 - In Exercises 1922, two variables are given that...Ch. 9.1 - In Exercises 1922, two variables are given that...Ch. 9.1 - In Exercises 1922, two variables are given that...Ch. 9.1 - In Exercises 1922, two variables are given that...Ch. 9.1 - Constructing a Scatter Plot and Determining...Ch. 9.1 - Constructing a Scatter Plot and Determining...Ch. 9.1 - Constructing a Scatter Plot and Determining...Ch. 9.1 - Constructing a Scatter Plot and Determining...Ch. 9.1 - Constructing a Scatter Plot and Determining...Ch. 9.1 - Constructing a Scatter Plot and Determining...Ch. 9.1 - In Exercise 23, add data for a child who is 6...Ch. 9.1 - In Exercise 24, remove the data for the girl who...Ch. 9.1 - In Exercise 25, remove the data for the...Ch. 9.1 - In Exercise 26, add data for an international...Ch. 9.1 - The t-Test for Correlation Coefficients In...Ch. 9.1 - The t-Test for Correlation Coefficients In...Ch. 9.1 - The t-Test for Correlation Coefficients In...Ch. 9.1 - The t-Test for Correlation Coefficients In...Ch. 9.1 - Interchanging x and y In Exercise 26, let the time...Ch. 9.1 - Generate a new data set. Using your knowledge of...Ch. 9.1 - Describe how to create a data set with a value of...Ch. 9.1 - Describe how to create a data set with a value of...Ch. 9.1 - Try to create a data set with a value of r that is...Ch. 9.2 - Find the equation of the regression line for the...Ch. 9.2 - Use technology to find the equation of the...Ch. 9.2 - The regression equation for the Old Faithful data...Ch. 9.2 - What is a residual? Explain when a residual is...Ch. 9.2 - Two variables have a positive linear correlation....Ch. 9.2 - Explain how to predict y-values using the equation...Ch. 9.2 - For a set of data and a corresponding regression...Ch. 9.2 - In order to predict y-values using the equation of...Ch. 9.2 - Why is it not appropriate to use a regression line...Ch. 9.2 - In Exercises 712, match the description in the...Ch. 9.2 - In Exercises 712, match the description in the...Ch. 9.2 - In Exercises 712, match the description in the...Ch. 9.2 - In Exercises 712, match the description in the...Ch. 9.2 - In Exercises 712, match the description in the...Ch. 9.2 - In Exercises 712, match the description in the...Ch. 9.2 - Graphical Analysis In Exercises 1316, match the...Ch. 9.2 - Graphical Analysis In Exercises 1316, match the...Ch. 9.2 - Graphical Analysis In Exercises 1316, match the...Ch. 9.2 - Graphical Analysis In Exercises 1316, match the...Ch. 9.2 - Finding the Equation of a Regression Line In...Ch. 9.2 - Finding the Equation of a Regression Line In...Ch. 9.2 - Finding the Equation of a Regression Line In...Ch. 9.2 - Finding the Equation of a Regression Line In...Ch. 9.2 - Finding the Equation of a Regression Line In...Ch. 9.2 - Finding the Equation of a Regression Line In...Ch. 9.2 - Finding the Equation of a Regression Line In...Ch. 9.2 - Finding the Equation of a Regression Line In...Ch. 9.2 - Finding the Equation of a Regression Line In...Ch. 9.2 - Finding the Equation of a Regression Line In...Ch. 9.2 - Registered Nurse Salaries In Exercises 2730, use...Ch. 9.2 - Registered Nurse Salaries In Exercises 2730, use...Ch. 9.2 - Registered Nurse Salaries In Exercises 2730, use...Ch. 9.2 - Registered Nurse Salaries In Exercises 2730, use...Ch. 9.2 - Interchanging X and y In Exercises 31 and 32,...Ch. 9.2 - Interchanging X and y In Exercises 31 and 32,...Ch. 9.2 - In Exercises 33 and 34, (a) find the equation of...Ch. 9.2 - In Exercises 33 and 34, (a) find the equation of...Ch. 9.2 - In Exercises 35 and 36, (a) construct a scatter...Ch. 9.2 - Prob. 36ECh. 9.2 - Prob. 37ECh. 9.2 - Prob. 38ECh. 9.2 - Prob. 39ECh. 9.2 - Prob. 40ECh. 9.2 - Prob. 41ECh. 9.2 - Prob. 42ECh. 9.2 - Prob. 43ECh. 9.2 - Prob. 44ECh. 9.2 - Prob. 45ECh. 9.2 - Prob. 46ECh. 9.2 - Prob. 47ECh. 9.2 - Prob. 48ECh. 9.2 - Prob. 1ACh. 9.2 - Prob. 2ACh. 9.2 - Prob. 3ACh. 9.2 - Prob. 4ACh. 9.3 - The correlation coefficient for the Old Faithful...Ch. 9.3 - Prob. 2TYCh. 9.3 - Using the results of Example 2, construct a 95%...Ch. 9.3 - Graphical Analysis In Exercises 13, use the...Ch. 9.3 - Graphical Analysis In Exercises 13, use the...Ch. 9.3 - Graphical Analysis In Exercises 13, use the...Ch. 9.3 - The coefficient of determination r2 is the ratio...Ch. 9.3 - What is the coefficient of determination for two...Ch. 9.3 - Two variables have a bivariate normal...Ch. 9.3 - In Exercises 710, use the value of the correlation...Ch. 9.3 - In Exercises 710, use the value of the correlation...Ch. 9.3 - In Exercises 710, use the value of the correlation...Ch. 9.3 - In Exercises 710, use the value of the correlation...Ch. 9.3 - Finding the Coefficient of Determination and the...Ch. 9.3 - Finding the Coefficient of Determination and the...Ch. 9.3 - Finding the Coefficient of Determination and the...Ch. 9.3 - Finding the Coefficient of Determination and the...Ch. 9.3 - Finding the Coefficient of Determination and the...Ch. 9.3 - Finding the Coefficient of Determination and the...Ch. 9.3 - Finding the Coefficient of Determination and the...Ch. 9.3 - Finding the Coefficient of Determination and the...Ch. 9.3 - Finding the Coefficient of Determination and the...Ch. 9.3 - Finding the Coefficient of Determination and the...Ch. 9.3 - Constructing and Interpreting a Prediction...Ch. 9.3 - Constructing and Interpreting a Prediction...Ch. 9.3 - Constructing and Interpreting a Prediction...Ch. 9.3 - Constructing and Interpreting a Prediction...Ch. 9.3 - STEM Employment and Mean Wage The table shows the...Ch. 9.3 - Constructing and Interpreting a Prediction...Ch. 9.3 - Constructing and Interpreting a Prediction...Ch. 9.3 - Fund Assets The table shows the total assets (in...Ch. 9.3 - New-Vehicle Sales The table shows the numbers of...Ch. 9.3 - New-Vehicle Sales The table shows the numbers of...Ch. 9.3 - Old Vehicles In Exercises 3134, use the figure...Ch. 9.3 - Old Vehicles In Exercises 3134, use the figure...Ch. 9.3 - Old Vehicles In Exercises 3134, use the figure...Ch. 9.3 - Old Vehicles In Exercises 3134, use the figure...Ch. 9.3 - Prob. 35ECh. 9.3 - Prob. 36ECh. 9.3 - Prob. 37ECh. 9.3 - In Exercises 37 and 38, construct the indicated...Ch. 9.4 - A statistics professor wants to determine how...Ch. 9.4 - Use the regression equation found in Try It...Ch. 9.4 - Predicting y-Values In Exercises 14, use the...Ch. 9.4 - Predicting y-Values In Exercises 14, use the...Ch. 9.4 - Prob. 3ECh. 9.4 - Predicting y-Values In Exercises 14, use the...Ch. 9.4 - Finding a Multiple Regression Equation In...Ch. 9.4 - Finding a Multiple Regression Equation In...Ch. 9.4 - In Exercises 7 and 8, calculate r2adi and...Ch. 9.4 - In Exercises 7 and 8, calculate r2adi and...Ch. 9 - In Exercises 14, (a) display the data in a scatter...Ch. 9 - In Exercises 14, (a) display the data in a scatter...Ch. 9 - In Exercises 14, (a) display the data in a scatter...Ch. 9 - In Exercises 14, (a) display the data in a scatter...Ch. 9 - Prob. 9.1.5RECh. 9 - Prob. 9.1.6RECh. 9 - Prob. 9.1.7RECh. 9 - Prob. 9.1.8RECh. 9 - In Exercises 912, find the equation of the...Ch. 9 - Prob. 9.2.10RECh. 9 - In Exercises 912, find the equation of the...Ch. 9 - Prob. 9.2.12RECh. 9 - In Exercises 1316, use the value of the...Ch. 9 - Prob. 9.3.14RECh. 9 - Prob. 9.3.15RECh. 9 - Prob. 9.3.16RECh. 9 - Prob. 9.3.17RECh. 9 - Prob. 9.3.18RECh. 9 - Prob. 9.3.19RECh. 9 - Prob. 9.3.20RECh. 9 - Prob. 9.3.21RECh. 9 - In Exercises 1924, construct the indicated...Ch. 9 - Prob. 9.3.23RECh. 9 - Prob. 9.3.24RECh. 9 - Prob. 9.4.25RECh. 9 - Prob. 9.4.26RECh. 9 - Prob. 9.4.27RECh. 9 - Prob. 9.4.28RECh. 9 - Prob. 1CQCh. 9 - For Exercises 18, use the data in the table, which...Ch. 9 - Prob. 3CQCh. 9 - Prob. 4CQCh. 9 - Prob. 5CQCh. 9 - Prob. 6CQCh. 9 - Prob. 7CQCh. 9 - For Exercises 18, use the data in the table, which...Ch. 9 - Prob. 9CQCh. 9 - Net Sales The equation used to predict the net...Ch. 9 - For Exercises 29, use the data in the table, which...Ch. 9 - For Exercises 29, use the data in the table, which...Ch. 9 - For Exercises 29, use the data in the table, which...Ch. 9 - For Exercises 29, use the data in the table, which...Ch. 9 - For Exercises 29, use the data in the table, which...Ch. 9 - For Exercises 29, use the data in the table, which...Ch. 9 - For Exercises 29, use the data in the table, which...Ch. 9 - For Exercises 29, use the data in the table, which...Ch. 9 - Analyzing the Data (a) The data in the table show...Ch. 9 - Making Predictions Construct a 95% prediction...Ch. 9 - Prob. 1TCh. 9 - Prob. 2TCh. 9 - Prob. 3TCh. 9 - Prob. 4TCh. 9 - Prob. 5TCh. 9 - Use technology to find the multiple regression...Ch. 9 - Prob. 7T
Knowledge Booster


Learn more about
Need a deep-dive on the concept behind this application? Look no further. Learn more about this topic, statistics and related others by exploring similar questions and additional content below.Similar questions
- Oil ProductionThe following table shows the amount of crude oil in billions of barrels produced in the United States in recent years. Source: U.S. Energy Information Administration. Year Crude Oil Produced 2002 2.097 2003 2.060 2004 1.989 2005 1.893 2006 1.857 2007 1.853 2008 1.830 2009 1.954 2010 2.000 2011 2.063 2012 2.377 In this exercise we are interested in the total amount of crude oil produced over the 10-year period from mid-2002 to mid-2012, using the data for the 11 years above. One approach is to sum up the numbers in the second column, but only count half of the first and last numbers. Give the answer to this calculation. Approximate the amount of crude oil produced over the 10-year period 2002-2012 by taking the average of the left endpoint sum and the right endpoint sum. Explain why this is equivalent to the calculation done in part a. This is also equivalent to a formula known as the trapezoidal rule, discussed in the next chapter. If your calculator has a cubic regression feature, find the best-fitting cubic function for these data, letting t=0 correspond to 2000. Then integrate this equation over the interval [2.12] to estimate the amount of crude oil produced over this time period. Compare with your answer to part a.arrow_forwardRunning In 1987, Canadian Ben Johnson set a world record in the 100-m sprint.The record was later taken away when he was found to have used an anabolic steroid to enhance his performance. His speed at various times in the race is given in the following table . Source: Information Graphics. Timesec Speedmph 0 0 1.84 12.9 3.80 23.8 6.38 26.3 7.23 26.3 8.96 26.0 9.83 25.7 a. Use the information in the table and left endpoints to estimate the distance that Johnson ran in miles. You will first need to calculate t for each interval. At the end, you will need to divide by 3600 the number of seconds in an hour, since the speed is in miles per hour. b. Repeat part a, using right endpoints. c. Wait a minute, we know that the distance Johnson ran is 100m. Divide this by 1609, the number of meters in a mile, to find how far Johnson ran in miles. Is your answer from part a or part b closer to the true answer? Briefly explain why you think this answer should be more accurate. d.arrow_forwardUsing the model in Example 6, estimate the number of cases of flu on day 15.arrow_forward
Recommended textbooks for you
 Calculus For The Life SciencesCalculusISBN:9780321964038Author:GREENWELL, Raymond N., RITCHEY, Nathan P., Lial, Margaret L.Publisher:Pearson Addison Wesley,
 Linear Algebra: A Modern IntroductionAlgebraISBN:9781285463247Author:David PoolePublisher:Cengage Learning
 Holt Mcdougal Larson Pre-algebra: Student Edition...AlgebraISBN:9780547587776Author:HOLT MCDOUGALPublisher:HOLT MCDOUGAL
 Glencoe Algebra 1, Student Edition, 9780079039897...AlgebraISBN:9780079039897Author:CarterPublisher:McGraw Hill
 Big Ideas Math A Bridge To Success Algebra 1: Stu...AlgebraISBN:9781680331141Author:HOUGHTON MIFFLIN HARCOURTPublisher:Houghton Mifflin Harcourt
 Algebra & Trigonometry with Analytic GeometryAlgebraISBN:9781133382119Author:SwokowskiPublisher:Cengage
Calculus For The Life Sciences
Calculus
ISBN:9780321964038
Author:GREENWELL, Raymond N., RITCHEY, Nathan P., Lial, Margaret L.
Publisher:Pearson Addison Wesley,
Linear Algebra: A Modern Introduction
Algebra
ISBN:9781285463247
Author:David Poole
Publisher:Cengage Learning
Holt Mcdougal Larson Pre-algebra: Student Edition...
Algebra
ISBN:9780547587776
Author:HOLT MCDOUGAL
Publisher:HOLT MCDOUGAL
Glencoe Algebra 1, Student Edition, 9780079039897...
Algebra
ISBN:9780079039897
Author:Carter
Publisher:McGraw Hill
Big Ideas Math A Bridge To Success Algebra 1: Stu...
Algebra
ISBN:9781680331141
Author:HOUGHTON MIFFLIN HARCOURT
Publisher:Houghton Mifflin Harcourt
Algebra & Trigonometry with Analytic Geometry
Algebra
ISBN:9781133382119
Author:Swokowski
Publisher:Cengage
Hypothesis Testing using Confidence Interval Approach; Author: BUM2413 Applied Statistics UMP;https://www.youtube.com/watch?v=Hq1l3e9pLyY;License: Standard YouTube License, CC-BY
Hypothesis Testing - Difference of Two Means - Student's -Distribution & Normal Distribution; Author: The Organic Chemistry Tutor;https://www.youtube.com/watch?v=UcZwyzwWU7o;License: Standard Youtube License