
Concept explainers
Videos
Finding the Equation of a Regression Line In Exercises 17–26, find the equation of the regression line for the data. Then construct a
21. Heart Rate and QT Interval The heart rates (in beats per minute and QT intervals (in milliseconds) for 13 males (The figure at the left shows the QT interval of a heartbeat in an electrocardiogram). (Adapted from Chest)
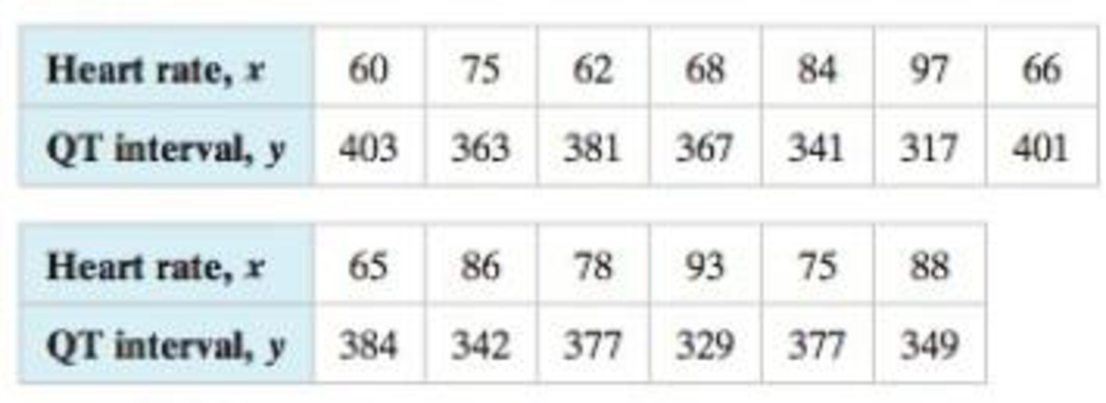
(a) x = 120 beats per minute
(b) x = 67 beats per minute
(c) x = 90 beats per minute
(d) x = 83 beats per minute
Want to see the full answer?
Check out a sample textbook solution
Chapter 9 Solutions
Elementary Statistics: Picturing the World (7th Edition)


- -Using the data in Table 6–11, answer the following: What is the slope? What is the intercept? Write the regression equation. Calculate a regression forecast for month 25.arrow_forwardRegression and Predictions. Exercises 13–28 use the same data sets as Exercises 13–28 in Section 10-1. In each case, find the regression equation, letting the first variable be the predictor (x) variable. Find the indicated predicted value by following the prediction procedure summarized in Figure 10-5 on page 493. Tips Using the bill/tip data, find the best predicted tip amount for a dinner bill of $100. What tipping rule does the regression equation suggest?arrow_forwardIt is a model that shows or predict the relationship between two variables. A. Linear Regression B. Correlation Coefficient C. Statistics D. Cryptographyarrow_forward
- Regression and Predictions. Exercises 13–28 use the same data sets as Exercises 13–28 in Section 10-1. In each case, find the regression equation, letting the first variable be the predictor (x) variable. Find the indicated predicted value by following the prediction procedure summarized in Figure 10-5 on page 493. Oscars Using the listed actress/actor ages, find the best predicted age of the Best Actor given that the age of the Best Actress is 54 years. Is the result reasonably close to the Best Actor’s (Eddie Redmayne) actual age of 33 years, which happened in 2015, when the Best Actress was Julianne Moore, who was 54 years of age?arrow_forwardManagement proposed the following regression model to predict sales at a fast-food outlet.arrow_forwardRefer to the data set:(-1, 2), (1, 3), (1, 5), (2, 7), (3, 8), (4, 11)Part a: Make a scatter plot and determine which type of model best fits the data.Part b: Find the regression equation.Part c: Use the equation from Part b to determine y when x = 10arrow_forward
- Statistical technique used to determine the degree to which two variables are related is known as a. Regression b. Correlation c. None of these d. Dispersionarrow_forwardA researcher is proposing that exercise makes a person more energized as a result they require less sleep. He carries out a survey on the number of hours of exercise per week and the average hours of sleep needed per night in order to feel well rested. The results are shown in the table (picture) for the 8 participants. a. Using the data (picture), calculate and interpret the regression line for the data.arrow_forwardD. Calculate a linear regression using Stabley. Write the equation below. E. What is the correlation coefficient? f. What is the slope of your LSRL? Interpret the slope using context. G. What is the Y- intercept of your LSRL? Interpret the Y-intercept using contextarrow_forward
- Regression analysis. The owner of a small hardware store has noted has a sales patter for window locks that seems to parallel the number of break -ins reported each week in the newspaper. The data are : Sales 46 18 20 22 27 34 14 37 30 Break-ins 9 3 3 5 4 7 2 6 4 Plot the data to determine which types of equation, linear or nonlinear. is appropriate. Obtain a regression equation for the data Estimate average sales when the number of break -ins is five.arrow_forwardsearch Refer to the data set: y X -3 -2 =1 -00 .......... 1 8 1 7 −IN 01 1 2 2 4 Part a: Make a scatter plot and determine which type of model best fits the data. Part b: Find the regression equation. Part c: Use the equation from Part b to determine y when x = 5 For the toolbar, press ALT+F10 (PC) or ALT+FN+F10 (Mac). BIUS Paragraph V Arial h V © O Click Save and Submit to save and submit. Click Save All Answers to save all answers. 10pt DELLarrow_forwardDetermine whether the data in the table below are linear or nonlinear. -5 -3 1 3 y -3 3 6 Are the data linear or nonlinear? nonlinear lineararrow_forward
 Calculus For The Life SciencesCalculusISBN:9780321964038Author:GREENWELL, Raymond N., RITCHEY, Nathan P., Lial, Margaret L.Publisher:Pearson Addison Wesley,
 Glencoe Algebra 1, Student Edition, 9780079039897...AlgebraISBN:9780079039897Author:CarterPublisher:McGraw Hill