Thinking Like an Engineer: An Active Learning Approach (3rd Edition)
3rd Edition
ISBN: 9780133593211
Author: Elizabeth A. Stephan, David R. Bowman, William J. Park, Benjamin L. Sill, Matthew W. Ohland
Publisher: PEARSON
expand_more
expand_more
format_list_bulleted
Concept explainers
Videos
Textbook Question
Chapter 18, Problem 28ICA
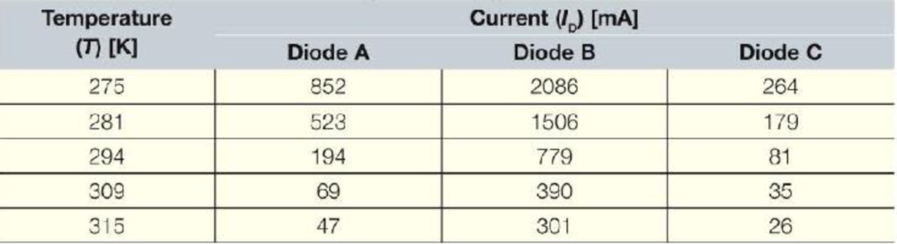
Three different diodes were tested: a constant voltage (0.65 volts) was held across each diode while the current through each was measured at various temperatures. The following data were obtained.
Create a proper plot of the data. Use polyfit to determine exponential models for each data set. For each model, add the trendline and the associated trendline equation to the graph
Expert Solution & Answer
Want to see the full answer?
Check out a sample textbook solution
Students have asked these similar questions
How do you determine which type of trendline to use on a graph?
The accepted or proposed experimental formula for the quantity
The type that passes through every single point
The best-fit parameter value (R^2)
a and c
As the potential across the resistor increased, the current through the resistor increased. If the change in current is proportional to the voltage, the data should be in a straight line and it should go through zero. In these two examples how close is the y-intercept to zero? Is there a proportional relationship between voltage and current? If so, write the equation for each run in the form potential = constant x current. (Use a numerical value for the constant.)
As an exercise, a student weighed several bunches of nails on a balance. The nails were
not all the same size. Here are the student's data:
4.
number of nails
mass in grams
82
122
208
324
435
12
20
26
Prepare a plot of these data on the grid below or on the graph paper. Use "number of
nails" as the independent variable and be certain to scale and label the axes correctly.
Scale the axes starting at the origin; 0, 0.
GO
20
向 12 円
Number of nails Cx)
2.
18
20
mass in
Chapter 18 Solutions
Thinking Like an Engineer: An Active Learning Approach (3rd Edition)
Ch. 18.1 - a. Write an input statement to ask for the users...Ch. 18.1 - Prob. 2CCCh. 18.1 - Prob. 3CCCh. 18.2 - Assume that the variable M is stored in the...Ch. 18.2 - Prob. 5CCCh. 18 - Write a MATLAB statement that results in the input...Ch. 18 - You are writing code that is part of a purchasing...Ch. 18 - Prob. 3ICACh. 18 - Prob. 4ICACh. 18 - Prob. 5ICA
Ch. 18 - Assume that a three-element row vector v already...Ch. 18 - The tiles on the space shuttle are constructed to...Ch. 18 - The specific gravity of acetic acid (vinegar) is...Ch. 18 - Write a MATLAB program that will allow a user to...Ch. 18 - Write a program that will allow the user to type a...Ch. 18 - In order to calculate the pressure in a flask,...Ch. 18 - Write a program that will allow the user to type...Ch. 18 - Write a MATLAB program that will ask users to...Ch. 18 - Write a program that asks a user to enter, one at...Ch. 18 - Joules first law, also known as the Joule effect,...Ch. 18 - Create a proper plot of the following set of...Ch. 18 - Prob. 17ICACh. 18 - You want to create a graph showing the theoretical...Ch. 18 - The decay of a radioactive isotope can be...Ch. 18 - Create a proper plot of the theoretical voltage...Ch. 18 - Plot the following functions as assigned by your...Ch. 18 - Plot the following functions as assigned by your...Ch. 18 - If an object is heated, the temperature of the...Ch. 18 - The resistance of a typical carbon film resistor...Ch. 18 - Today, most traffic lights have a delayed green,...Ch. 18 - Cadmium sulfide (CdS) is a semiconducting material...Ch. 18 - Your supervisor has assigned you the task of...Ch. 18 - Three different diodes were tested: a constant...Ch. 18 - If a hot liquid in a container is left to cool,...Ch. 18 - You are an engineer working for M M / Mars...Ch. 18 - 1. The specific gravity of gold is 19.3. Write a...Ch. 18 - An unmanned X-43A scramjet test vehicle has...Ch. 18 - A rod on the surface of Jupiter's moon Callisto...Ch. 18 - The Eco-Marathon is an annual competition...Ch. 18 - Write a function and program to determine the mass...Ch. 18 - Prob. 6RQCh. 18 - You are part of an engineering firm on contract...Ch. 18 - Prob. 8RQCh. 18 - Prob. 9RQCh. 18 - When one tries to stop a car, both the reaction...Ch. 18 - Prob. 11RQCh. 18 - Prob. 12RQCh. 18 - Prob. 13RQCh. 18 - Prob. 14RQCh. 18 - Prob. 15RQCh. 18 - Prob. 16RQCh. 18 - Prob. 17RQCh. 18 - Prob. 18RQCh. 18 - Prob. 19RQCh. 18 - Prob. 20RQCh. 18 - Prob. 21RQCh. 18 - Prob. 22RQCh. 18 - Prob. 23RQCh. 18 - Prob. 24RQCh. 18 - Prob. 25RQCh. 18 - Prob. 26RQCh. 18 - Prob. 27RQCh. 18 - Prob. 28RQCh. 18 - Download the weekly retail gasoline and diesel...Ch. 18 - A sample of the data provided in the Microsoft...Ch. 18 - An Excel file named DartTosses.xlsx has one...
Knowledge Booster


Learn more about
Need a deep-dive on the concept behind this application? Look no further. Learn more about this topic, mechanical-engineering and related others by exploring similar questions and additional content below.Similar questions
- The following graph shows a load-extension graph from a test on a polymer specimen 15mm in diameter and 45mm long. The rightmost datapoint represents the reading at the point of fracture. Load (KN) 20 15- 5- 0.2 0.4 Extension (mm) 0.6 a) 0.2% offset yield strength b) The tensile strength c) The modulus of elasticity 0.8 F Determine the following physical properties. Show all your working and express all your answers in appropriate Sl units where appropriate: 1.0 d) The % elongation e) The engineering stress at fracture f) Estimate the modulus of resiliencearrow_forwardHi please help with this question thank you I just can't seem to work it out even with the given formulas. Thanks! also, I have tried these but they seem to be incorrect, or maybe parts of the calculation may be incorrect since when I submit these all together and I can't really work out where I am going wrong: sigma x = 25.43 sigma y = 13.07 Txy = 49.124arrow_forward1) Graph 1: plot t on the abscissa versus y on the ordinate and (artistically) draw a smooth line through the points. The line need not actually go through each data point. 2) Graph 2: plot t^2 on the abscissa versus y on the ordinate and then perform a linear regression. Remember to plot both the raw data points and the line of best fit (with the two points used to draw it); also show the regression equation and r value on the graph. 3) On graph (1), what does the slope of the line tell you about the velocity of the ball? Be thorough! 4) On graph 2: a) What does the slope of the line tell you about the acceleration of the ball? Be thorough! b) Calculate g from the freefall data and the % error (in comparison to 9.81 m/s^2) using the results from the linear regression calculation. c) What do the values of the y-intercept and correlation coefficient (r) tell you?arrow_forward
- According to Hooke's Law, we need to be measuring x (the length of the spring) however our CBR is set up to measure y( the height of the bottom of the mass). Create a diagram and explains why we can swap out x variables for y variables when conducting this experiment x yarrow_forwardTruncation errors are increased as the round-off errors are decreased.Group of answer choices True False Say, you have a thermometer and you are checking the temperature of a body that has a temperature of 36o Using your thermometer five times, it gives you the following measurements: 29oC, 29.2oC, 29.3oC, 28.9oC, and 29.1oC. What can we conclude about the accuracy and the precision of the thermometer?Group of answer choices The thermometer is not accurate and not precise The thermometer is faulty. The thermometer is accurate and precise The thermometer is not accurate but precise. Say, you have a thermometer and you are checking the temperature of a body that has a temperature of 36o Using your thermometer five times, it gives you the following measurements: 36oC, 35.6oC, 36oC, 37oC, and 36.2oC. What can we conclude about the accuracy and the precision of the thermometer?Group of answer choices The thermometer is accurate and precise. The thermometer is accurate but not precise. The…arrow_forwardIn your biomechanical testing lab, you perform a series of compression tests to determine the relationship between apparent bone density (p, units of g/cm³) and ultimate stress (ơult, units of MPa). Using the set of experimental measurements below, write an m-file to fit a power relationship of the form O uli = Ap to the data. Use the log transform method to linearize the system and data, followed by linear regression. Plot the data points and the power relationship on a single plot. Be sure to label your axes and provide a legend. Provide a printout of your m-file and a printout of the command window showing your results. Write down the best fit equation and box it. 8.76 5.25 4.26 5.51 3.88 18.45 2.09 13.72 5.42 2.17 Oult (MPa) p (g/cm³) 0.598 | 0.459 0.319 | 0.235 0.141 0.754 0.177 0.553 0.394 0.246arrow_forward
- using the sine bar technique, find the value of the angle for the given data: the stacked height was composed of the following values, 30, 20, 5, 2 and 1.1 mm. The length of the sine bar is 150 mm. Support your answer by sketch.arrow_forwarddocs.google.com a The acceleration of an object is proportional to * its velocity its mass its position its displacement the net force acting on it When we say that light objects and heavy objects fall at the same rate, what assumption are we making? * They are falling in a vacuum. all of them They are made of the same material. They have the same shape. They have the same size. What does this graph indicate about the motion of an object ? * O O Oarrow_forwardII Question 2 A process instrument reading Z (volts) is thought to be related to a process stream flow rate V (L/s) and pressure P (kPa) by the expression: Z = aVÞp°. Using the three data points shown in the table above, calculate the constants a, b and c and indicate their units. In this particular case there is no regression to be performed, but only 3 equations in 3 unknowns to solve. 1 1.02 V (L/s) P (kPa) z (volts) 1.20 1.75 11.2 10.2 9.1 2.58 3.72 3.50 ere to search 12arrow_forward
- QUESTION 2 Consider the following dataset and separator. What is the width of margin (distance between the two paralel lines )? Please use real numbers instead of rations. Eg, f your result is1/2, enter 0.5 w.x+b = +1 w.x+b =0 w.x+b= -1 2.0 0. 05 VW.warrow_forwardA thermocouple was used to measure the temperature. Over the range of temperatures expected in the experiment, a linear regression analysis was performed for the temperature as a function of voltage. The best-fit equation was T = (-0.008563 + 220*V), where V is the thermocouple voltage. The voltage was fed into a 11-bit A/D converter with a voltage range of -8 V to 8 V. Determine the measurement resolution (in °C) due to the ADC? O 0.851 None O 3.113 1.710 0.393 4.960 1.144 O 3.797arrow_forwardPartII Say you've deployed a robot that can can measure electric field due to specified charge at the specified location with good accuracy. And you got these results from the robot: Electric field due to q2 at point p1 is (-1667.0) i + (18340.0) j Electric field due to q3 at point p1 is (-2496.0) i + (–1628.0) j Electric field due to q1 at point p2 is (-6311.0) î + (2470.0) } Electric field due to q2 at point p2 is (-11585.0) î + (–6951.0) ĵ Electric field due to q3 at point p2 is (4657.0) î + (11310.0) } c) Find the net Electric field at pj .arrow_forward
arrow_back_ios
SEE MORE QUESTIONS
arrow_forward_ios
Recommended textbooks for you
 Elements Of ElectromagneticsMechanical EngineeringISBN:9780190698614Author:Sadiku, Matthew N. O.Publisher:Oxford University Press
 Mechanics of Materials (10th Edition)Mechanical EngineeringISBN:9780134319650Author:Russell C. HibbelerPublisher:PEARSON
 Thermodynamics: An Engineering ApproachMechanical EngineeringISBN:9781259822674Author:Yunus A. Cengel Dr., Michael A. BolesPublisher:McGraw-Hill Education
 Control Systems EngineeringMechanical EngineeringISBN:9781118170519Author:Norman S. NisePublisher:WILEY
 Mechanics of Materials (MindTap Course List)Mechanical EngineeringISBN:9781337093347Author:Barry J. Goodno, James M. GerePublisher:Cengage Learning
 Engineering Mechanics: StaticsMechanical EngineeringISBN:9781118807330Author:James L. Meriam, L. G. Kraige, J. N. BoltonPublisher:WILEY
Elements Of Electromagnetics
Mechanical Engineering
ISBN:9780190698614
Author:Sadiku, Matthew N. O.
Publisher:Oxford University Press
Mechanics of Materials (10th Edition)
Mechanical Engineering
ISBN:9780134319650
Author:Russell C. Hibbeler
Publisher:PEARSON
Thermodynamics: An Engineering Approach
Mechanical Engineering
ISBN:9781259822674
Author:Yunus A. Cengel Dr., Michael A. Boles
Publisher:McGraw-Hill Education
Control Systems Engineering
Mechanical Engineering
ISBN:9781118170519
Author:Norman S. Nise
Publisher:WILEY
Mechanics of Materials (MindTap Course List)
Mechanical Engineering
ISBN:9781337093347
Author:Barry J. Goodno, James M. Gere
Publisher:Cengage Learning
Engineering Mechanics: Statics
Mechanical Engineering
ISBN:9781118807330
Author:James L. Meriam, L. G. Kraige, J. N. Bolton
Publisher:WILEY
Fluid Mechanics - Viscosity and Shear Strain Rate in 9 Minutes!; Author: Less Boring Lectures;https://www.youtube.com/watch?v=_0aaRDAdPTY;License: Standard youtube license