
Modern Business Statistics with Microsoft Office Excel (with XLSTAT Education Edition Printed Access Card) (MindTap Course List)
6th Edition
ISBN: 9781337115186
Author: David R. Anderson, Dennis J. Sweeney, Thomas A. Williams, Jeffrey D. Camm, James J. Cochran
Publisher: Cengage Learning
expand_more
expand_more
format_list_bulleted
Concept explainers
Videos
Textbook Question
Chapter 16, Problem 28SE
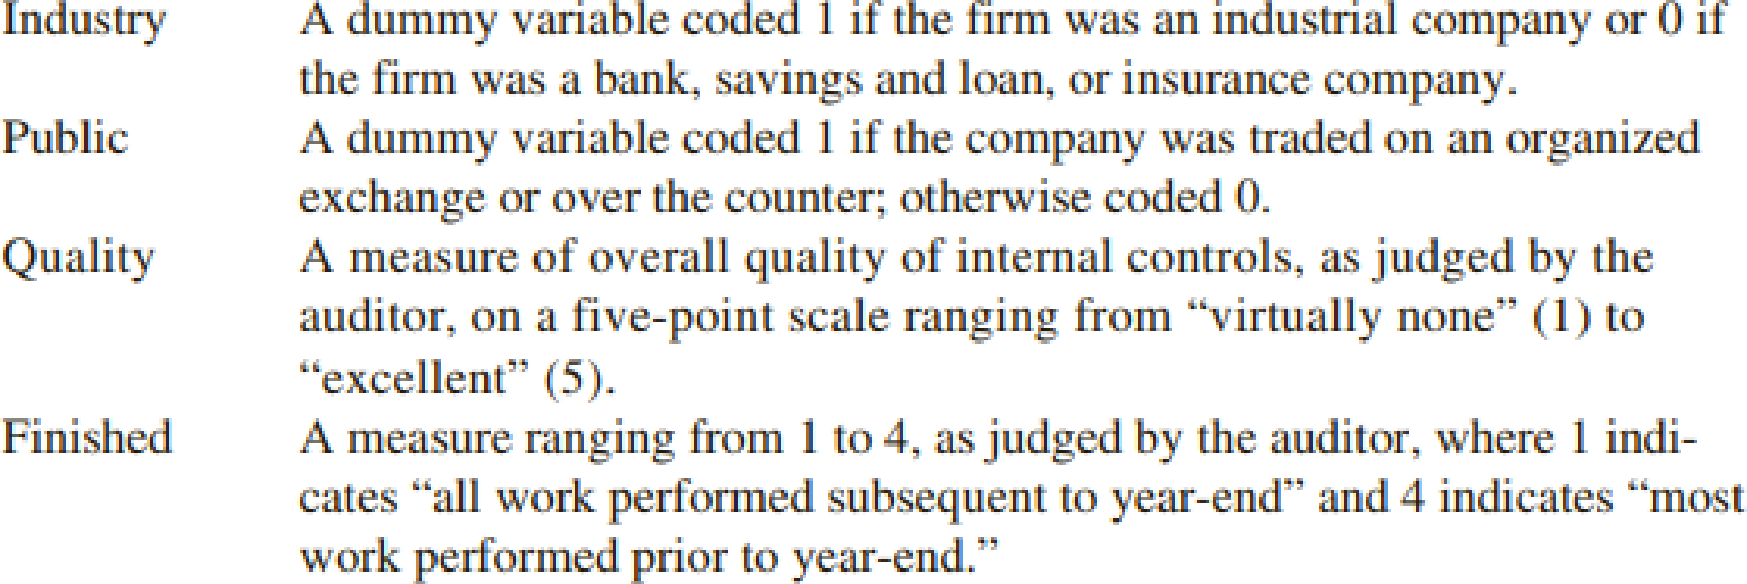
A study investigated the relationship between audit delay (Delay), the length of time from a company’s fiscal year-end to the date of the auditor’s report, and variables that describe the client and the auditor. Some of the independent variables that were included in this study follow.
A sample of 40 companies provided the following data.
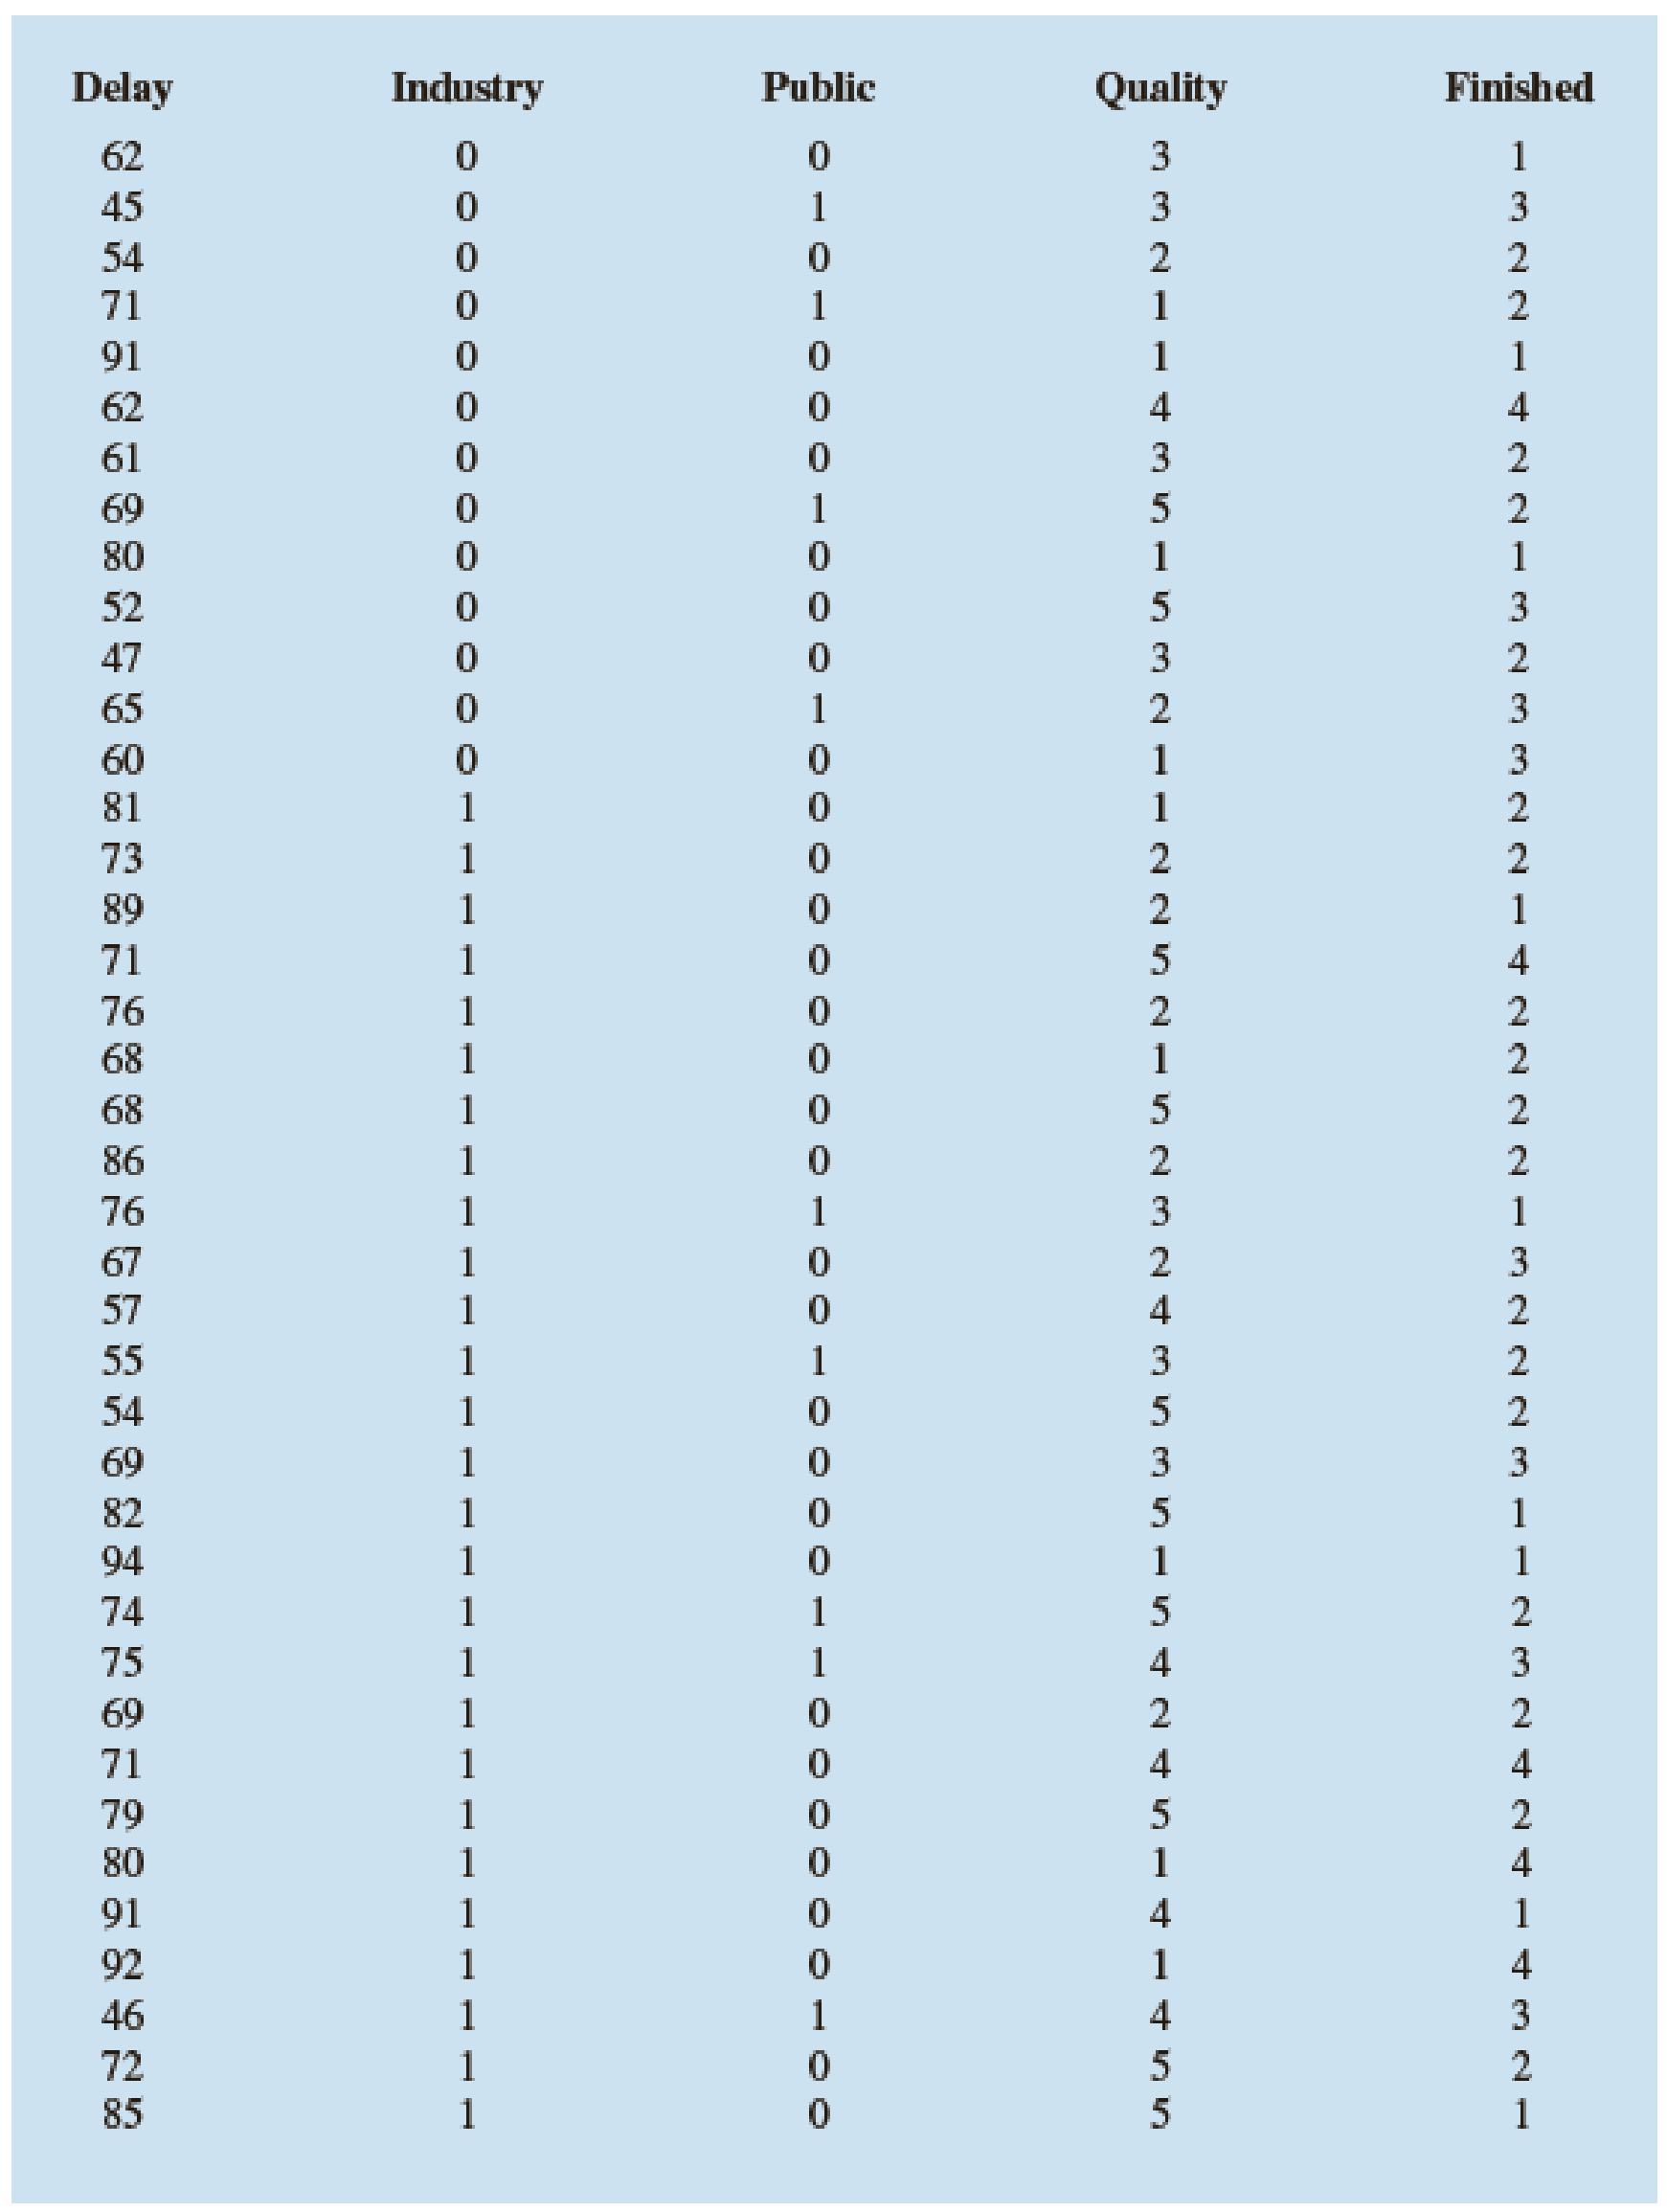
- a. Develop the estimated regression equation using all of the independent variables.
- b. Did the estimated regression equation developed in part (a) provide a good fit? Explain.
- c. Develop a
scatter diagram showing Delay as afunction of Finished. What does this scatter diagram indicate about the relationship between Delay and Finished? - d. On the basis of your observations about the relationship between Delay and Finished, develop an alternative estimated regression equation to the one developed in (a) to explain as much of the variability in Delay as possible.
Expert Solution & Answer

Trending nowThis is a popular solution!

Students have asked these similar questions
The St. Lucian Government is interested in predicting the number of weekly riders on the public buses using the following variables:
• • • •
Price of bus trips per weekThe population in the cityThe monthly income of ridersAverage rate to park your personal vehicle
Determine the multiple regression equation for the data.
What is the predicted value of the number of weekly riders if: price of bus trips per week = $24; population = $2,000,000; the monthly income of riders = $13,500; and average rate to park your personal vehicle = $150.
Interpret the coefficient of determination.
Chapter 16 Solutions
Modern Business Statistics with Microsoft Office Excel (with XLSTAT Education Edition Printed Access Card) (MindTap Course List)
Ch. 16.1 - Consider the following data for two variables, x...Ch. 16.1 - Consider the following data for two variables, x...Ch. 16.1 - Prob. 3ECh. 16.1 - A highway department is studying the relationship...Ch. 16.1 - In working further with the problem of exercise 4,...Ch. 16.1 - A study of emergency service facilities...Ch. 16.1 - Home Depot, a nationwide home improvement...Ch. 16.1 - Corvette, Ferrari, and Jaguar produced a variety...Ch. 16.1 - The film Suicide Squad has an average rating of...Ch. 16.2 - In a regression analysis involving 27...
Ch. 16.2 - Prob. 11ECh. 16.2 - The Professional Golfers’ Association of America...Ch. 16.2 - Refer to exercise 12.
Develop an estimated...Ch. 16.2 - A 10-year study conducted by the American Heart...Ch. 16.2 - The average monthly residential gas bill for Black...Ch. 16.5 - Prob. 16ECh. 16.5 - Prob. 17ECh. 16.5 - Prob. 18ECh. 16.5 - Prob. 19ECh. 16.5 - Prob. 20ECh. 16.5 - Prob. 21ECh. 16.5 - Prob. 22ECh. 16.5 - Prob. 23ECh. 16.6 - The following data show the daily closing prices...Ch. 16.6 - Refer to the Cravens data set in Table 16.5. In...Ch. 16 - A sample containing years to maturity and yield...Ch. 16 - Consumer Reports tested 19 different brands and...Ch. 16 - A study investigated the relationship between...Ch. 16 - Refer to the data in exercise 28. Consider a model...Ch. 16 - Refer to the data in exercise 28.
Develop an...Ch. 16 - Prob. 31SECh. 16 - The Ladies Professional Golf Association (LPGA)...Ch. 16 - Wine Spectator magazine contains articles and...
Knowledge Booster


Learn more about
Need a deep-dive on the concept behind this application? Look no further. Learn more about this topic, statistics and related others by exploring similar questions and additional content below.Recommended textbooks for you
 Glencoe Algebra 1, Student Edition, 9780079039897...AlgebraISBN:9780079039897Author:CarterPublisher:McGraw Hill
 Calculus For The Life SciencesCalculusISBN:9780321964038Author:GREENWELL, Raymond N., RITCHEY, Nathan P., Lial, Margaret L.Publisher:Pearson Addison Wesley,
 Big Ideas Math A Bridge To Success Algebra 1: Stu...AlgebraISBN:9781680331141Author:HOUGHTON MIFFLIN HARCOURTPublisher:Houghton Mifflin Harcourt
Glencoe Algebra 1, Student Edition, 9780079039897...
Algebra
ISBN:9780079039897
Author:Carter
Publisher:McGraw Hill
Calculus For The Life Sciences
Calculus
ISBN:9780321964038
Author:GREENWELL, Raymond N., RITCHEY, Nathan P., Lial, Margaret L.
Publisher:Pearson Addison Wesley,
Big Ideas Math A Bridge To Success Algebra 1: Stu...
Algebra
ISBN:9781680331141
Author:HOUGHTON MIFFLIN HARCOURT
Publisher:Houghton Mifflin Harcourt
Correlation Vs Regression: Difference Between them with definition & Comparison Chart; Author: Key Differences;https://www.youtube.com/watch?v=Ou2QGSJVd0U;License: Standard YouTube License, CC-BY
Correlation and Regression: Concepts with Illustrative examples; Author: LEARN & APPLY : Lean and Six Sigma;https://www.youtube.com/watch?v=xTpHD5WLuoA;License: Standard YouTube License, CC-BY