
Mathematics All Around (6th Edition)
6th Edition
ISBN: 9780134434681
Author: Tom Pirnot
Publisher: PEARSON
expand_more
expand_more
format_list_bulleted
Videos
Textbook Question
Chapter 14.5, Problem 21E
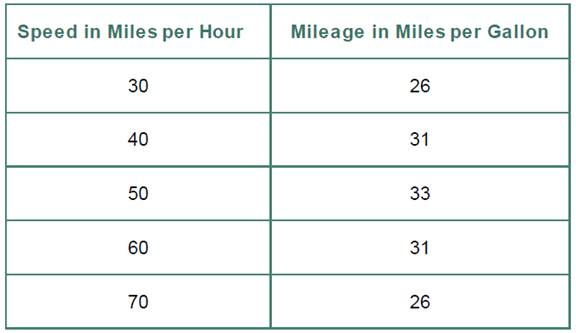
In Exercises 19 –22, find the line of best fit for the data in the specified exercise.
Exercise 17
17. As a car begins to accelerate, the gas mileage is poor. As the speed increases, the gas mileage begins to increase. The gas mileage increases for a while; then as the speed increases further, the mileage begins to decrease. The table of data illustrates this.
Expert Solution & Answer
Want to see the full answer?
Check out a sample textbook solution
Students have asked these similar questions
Using the data in Table 6–11, calculate a 3-month moving average forecast for month 12.
Using the data in Table 6–11, calculate a 3-month moving average forecastfor month 12.
Complete Part D
A recent issue of the AARP Bulletin reported that the average weekly pay for a woman with a high school degree is $520 (AARP Bulletin, January–February, 2010). Suppose you would like to determine if the average weekly pay for all working women is significantly greater than that for women with a high school degree. Data providing the weekly pay for a sample of 50 working women are available in the file named WeeklyPay. These data are consistent with the findings reported in the AARP article. Complete D
null hyposthesis: H(o)=520Alternative hypothesis: H(a): greater then 520
sample mean=637.94
the test statistic = 5.62
p-value=0.00
Using a=.05, we would reject the null hypothesis.
D. Repeat the hypothesis test using the critical value approach.
582
333
759
633
629
523
320
685
599
753
553
641
290
800
696
627
679
667
542
619
950
614
548
570
678
697
750
569…
Chapter 14 Solutions
Mathematics All Around (6th Edition)
Ch. 14.1 - Sharpening Your Skills. In Exercises 1 and 2,...Ch. 14.1 - Sharpening Your Skills. In Exercises 1 and 2,...Ch. 14.1 - Sharpening Your Skills. In Exercises 3 and 4,...Ch. 14.1 - Sharpening Your Skills. In Exercises 3 and 4,...Ch. 14.1 - Sharpening Your Skills. In Exercises 5 and 6,...Ch. 14.1 - Sharpening Your Skills. In Exercises 5 and 6,...Ch. 14.1 - Prob. 7ECh. 14.1 - Sharpening Your Skills. In Exercises 7 and 8,...Ch. 14.1 - Prob. 9ECh. 14.1 - Sharpening Your Skills. In Exercises 9 and 10,...
Ch. 14.1 - Prob. 11ECh. 14.1 - Prob. 12ECh. 14.1 - Applying What Youve Learned. Customers at...Ch. 14.1 - Applying What Youve Learned. Scheduling a rec...Ch. 14.1 - Applying What Youve Learned. Data similar to that...Ch. 14.1 - Applying What Youve Learned. Data similar to that...Ch. 14.1 - Comparing wage data. The following bar graphs...Ch. 14.1 - Applying What Youve Lerarned. Comparing wage data....Ch. 14.1 - Applying What Youve Learned. Comparing wage data....Ch. 14.1 - Applying What Youve Learned. Comparing wage data....Ch. 14.1 - Applying What Youve Learned. Comparing wage data....Ch. 14.1 - Prob. 22ECh. 14.1 - Prob. 23ECh. 14.1 - Prob. 24ECh. 14.1 - Prob. 25ECh. 14.1 - For Exercises 23 26, use the four graphs of the...Ch. 14.1 - Applying What Youve Learned. Comparing training...Ch. 14.1 - Applying What Youve Learned. Comparing weight-loss...Ch. 14.1 - Applying What Youve Learned. Super Bowl scores....Ch. 14.1 - Applying What Youve Learned. Law School Aptitude...Ch. 14.1 - In Exercises 31 34, first group the data using an...Ch. 14.1 - Applying What Youve Learned. In Exercises 31 34,...Ch. 14.1 - In Exercises 31 34, first group the data using an...Ch. 14.1 - Applying What Youve Learned. In Exercises 31 34,...Ch. 14.1 - Communicating Mathematics What is the difference...Ch. 14.1 - Communicating Mathematics If you are using a bar...Ch. 14.1 - Communicating Mathematics What is the difference...Ch. 14.1 - Communicating Mathematics What do you see as an...Ch. 14.1 - Challenge Yourself How might you present three...Ch. 14.1 - Challenge Yourself 42. The following table is an...Ch. 14.2 - Prob. 1ECh. 14.2 - Prob. 2ECh. 14.2 - Sharpening Your Skills Find the mean, median, and...Ch. 14.2 - Prob. 4ECh. 14.2 - Prob. 5ECh. 14.2 - Prob. 6ECh. 14.2 - Prob. 7ECh. 14.2 - Prob. 8ECh. 14.2 - Prob. 9ECh. 14.2 - Prob. 10ECh. 14.2 - Prob. 11ECh. 14.2 - Prob. 12ECh. 14.2 - Prob. 13ECh. 14.2 - Prob. 14ECh. 14.2 - Prob. 15ECh. 14.2 - Prob. 16ECh. 14.2 - In Exercises 1720, a give the five-number summary...Ch. 14.2 - Prob. 18ECh. 14.2 - In Exercises 1720, a give the five-number summary...Ch. 14.2 - In Exercises 1720, a give the five-number summary...Ch. 14.2 - In Exercises 2128, find the mean, median, and mode...Ch. 14.2 - In Exercises 2128, find the mean, median, and mode...Ch. 14.2 - In Exercises 2128, find the mean, median, and mode...Ch. 14.2 - In Exercises 2128, find the mean, median, and mode...Ch. 14.2 - In Exercises 2128, find the mean, median, and mode...Ch. 14.2 - In Exercises 2128, find the mean, median, and mode...Ch. 14.2 - In Exercises 2128, find the mean, median, and mode...Ch. 14.2 - In Exercises 2128, find the mean, median, and mode...Ch. 14.2 - Many colleges assign numerical points to grades as...Ch. 14.2 - Prob. 30ECh. 14.2 - Exam scores. Izzy had an 84 and an 86 on his first...Ch. 14.2 - Prob. 32ECh. 14.2 - Prob. 33ECh. 14.2 - Prob. 34ECh. 14.2 - Exam scores. Assume that in your History of Film...Ch. 14.2 - Prob. 36ECh. 14.2 - Prob. 37ECh. 14.2 - Prob. 38ECh. 14.2 - Prob. 39ECh. 14.2 - Example 6 Using Stem-and-Leaf Home Run Records...Ch. 14.2 - Prob. 41ECh. 14.2 - Prob. 42ECh. 14.2 - Prob. 43ECh. 14.2 - Prob. 44ECh. 14.2 - Prob. 45ECh. 14.2 - Prob. 46ECh. 14.2 - Prob. 47ECh. 14.2 - A college placement office has made a comparative...Ch. 14.2 - Prob. 49ECh. 14.2 - Prob. 50ECh. 14.2 - Give three separate real-life examples in which...Ch. 14.2 - Which measure of central tendency do you think is...Ch. 14.2 - Manipulating data. Choose some set of data...Ch. 14.2 - Analyzing misleading graphs. Find a graph in the...Ch. 14.2 - Prob. 55ECh. 14.2 - Prob. 56ECh. 14.2 - Prob. 57ECh. 14.2 - Prob. 58ECh. 14.2 - Prob. 59ECh. 14.2 - Prob. 60ECh. 14.2 - Prob. 61ECh. 14.2 - Prob. 62ECh. 14.2 - Prob. 63ECh. 14.2 - Prob. 64ECh. 14.2 - Prob. 65ECh. 14.3 - Sharpening Your Skills Find the range, mean, and...Ch. 14.3 - Sharpening Your Skills Find the range, mean, and...Ch. 14.3 - Sharpening Your Skills Find the range, mean, and...Ch. 14.3 - Sharpening Your Skills Find the range, mean, and...Ch. 14.3 - Sharpening Your Skills Find the range, mean, and...Ch. 14.3 - Sharpening Your Skills Find the range, mean, and...Ch. 14.3 - Sharpening Your Skills Find the range, mean, and...Ch. 14.3 - Sharpening Your Skills Find the range, mean, and...Ch. 14.3 - Prob. 9ECh. 14.3 - Prob. 10ECh. 14.3 - Prob. 11ECh. 14.3 - Prob. 12ECh. 14.3 - Prob. 13ECh. 14.3 - Prob. 14ECh. 14.3 - Prob. 15ECh. 14.3 - Prob. 16ECh. 14.3 - Prob. 17ECh. 14.3 - Prob. 18ECh. 14.3 - Prob. 19ECh. 14.3 - Applying What Youve Learned Summarizing age data....Ch. 14.3 - Prob. 21ECh. 14.3 - Prob. 22ECh. 14.3 - Prob. 23ECh. 14.3 - Prob. 24ECh. 14.3 - Prob. 25ECh. 14.3 - Prob. 26ECh. 14.3 - Prob. 27ECh. 14.3 - Prob. 28ECh. 14.3 - Prob. 29ECh. 14.3 - Prob. 30ECh. 14.3 - In Exercises 31 and 32, we present information on...Ch. 14.3 - In Exercises 31 and 32, we present information on...Ch. 14.3 - Human resources. As the manager of the human...Ch. 14.3 - Prob. 34ECh. 14.3 - Prob. 35ECh. 14.3 - Prob. 36ECh. 14.3 - Prob. 37ECh. 14.3 - Prob. 38ECh. 14.3 - Laptop batteries. A particular brand of laptop was...Ch. 14.3 - Study times. A group of students were sampled with...Ch. 14.3 - Prob. 41ECh. 14.3 - Prob. 42ECh. 14.3 - Prob. 43ECh. 14.3 - Use the following graphs for Exercise 44 a. Which...Ch. 14.3 - Prob. 45ECh. 14.3 - Prob. 46ECh. 14.3 - Prob. 47ECh. 14.3 - Prob. 48ECh. 14.4 - Assume that the distribution in Exercises 1 6 has...Ch. 14.4 - Assume that the distribution in Exercises 1 6 has...Ch. 14.4 - Assume that the distribution in Exercises 1 6 has...Ch. 14.4 - Assume that the distribution in Exercises 1 6 has...Ch. 14.4 - Assume that the distribution in Exercises 1 6 has...Ch. 14.4 - Assume that the distribution in Exercises 1 6 has...Ch. 14.4 - Assume that the distribution in Exercises 7 12...Ch. 14.4 - Assume that the distribution in Exercises 7 12...Ch. 14.4 - Assume that the distribution in Exercises 7 12...Ch. 14.4 - Assume that the distribution in Exercises 7 12...Ch. 14.4 - Assume that the distribution in Exercises 7 12...Ch. 14.4 - Assume that the distribution in Exercises 7 12...Ch. 14.4 - Use the following graph of the standard normal...Ch. 14.4 - Use the following graph of the standard normal...Ch. 14.4 - Use Table 14.19 to find the percent of the area...Ch. 14.4 - Use Table 14.19 to find the percent of the area...Ch. 14.4 - Use Table 14.19 to find the percent of the area...Ch. 14.4 - Prob. 18ECh. 14.4 - Prob. 19ECh. 14.4 - Prob. 20ECh. 14.4 - Prob. 21ECh. 14.4 - Prob. 22ECh. 14.4 - Use Table 14.19 to find the percent of the area...Ch. 14.4 - Prob. 24ECh. 14.4 - Use Table 14.19 to find the percent of the area...Ch. 14.4 - Use Table 14.19 to find the percent of the area...Ch. 14.4 - Use Table 14.19 to find the percent of the area...Ch. 14.4 - Prob. 28ECh. 14.4 - Use Table 14.19 to find the percent of the area...Ch. 14.4 - Prob. 30ECh. 14.4 - Use Table 14.19 to find the percent of the area...Ch. 14.4 - Prob. 32ECh. 14.4 - Use Table 14.19 to find the percent of the area...Ch. 14.4 - Prob. 34ECh. 14.4 - Prob. 35ECh. 14.4 - In Exercises 35 - 40, we give you a mean, a...Ch. 14.4 - Prob. 37ECh. 14.4 - Prob. 38ECh. 14.4 - Prob. 39ECh. 14.4 - Prob. 40ECh. 14.4 - Prob. 41ECh. 14.4 - In Exercises 41 - 46, we give you a mean, a...Ch. 14.4 - Prob. 43ECh. 14.4 - Prob. 44ECh. 14.4 - Prob. 45ECh. 14.4 - Prob. 46ECh. 14.4 - Prob. 47ECh. 14.4 - Prob. 48ECh. 14.4 - Prob. 49ECh. 14.4 - Prob. 50ECh. 14.4 - Prob. 51ECh. 14.4 - Prob. 52ECh. 14.4 - Prob. 53ECh. 14.4 - Prob. 54ECh. 14.4 - Prob. 55ECh. 14.4 - Prob. 56ECh. 14.4 - Prob. 57ECh. 14.4 - Prob. 58ECh. 14.4 - Prob. 59ECh. 14.4 - Prob. 60ECh. 14.4 - Prob. 61ECh. 14.4 - Prob. 62ECh. 14.4 - Prob. 63ECh. 14.4 - Weight lifting.In a power lifting competition the...Ch. 14.4 - Strength of cables.A certain type of cable has a...Ch. 14.4 - Prob. 66ECh. 14.4 - Prob. 67ECh. 14.4 - Prob. 68ECh. 14.4 - Prob. 69ECh. 14.4 - Prob. 70ECh. 14.4 - Prob. 71ECh. 14.4 - Prob. 72ECh. 14.4 - Prob. 73ECh. 14.4 - Prob. 74ECh. 14.4 - Analyzing the SATs. Assume that the math SAT...Ch. 14.4 - Prob. 76ECh. 14.4 - Prob. 77ECh. 14.4 - Prob. 78ECh. 14.4 - Prob. 79ECh. 14.4 - Prob. 80ECh. 14.4 - Prob. 81ECh. 14.4 - Prob. 82ECh. 14.4 - Prob. 83ECh. 14.4 - Prob. 84ECh. 14.4 - Prob. 85ECh. 14.4 - Prob. 86ECh. 14.4 - If a distribution has a mean of 40 and a standard...Ch. 14.4 - Prob. 88ECh. 14.4 - Prob. 89ECh. 14.4 - Prob. 90ECh. 14.5 - In Exercises 1 and 2, state what kind of...Ch. 14.5 - In Exercises 1 and 2, state what kind of...Ch. 14.5 - For Exercises 3 6, do the following: a. Plot the...Ch. 14.5 - Prob. 4ECh. 14.5 - Prob. 5ECh. 14.5 - Prob. 6ECh. 14.5 - Prob. 7ECh. 14.5 - Prob. 8ECh. 14.5 - Prob. 9ECh. 14.5 - Prob. 10ECh. 14.5 - Prob. 11ECh. 14.5 - Prob. 12ECh. 14.5 - In Exercises 11 14, find the line of best fit for...Ch. 14.5 - Prob. 14ECh. 14.5 - Prob. 15ECh. 14.5 - Prob. 16ECh. 14.5 - Prob. 17ECh. 14.5 - Prob. 18ECh. 14.5 - In Exercises 19 22, find the line of best fit for...Ch. 14.5 - In Exercises 19 22, find the line of best fit for...Ch. 14.5 - In Exercises 19 22, find the line of best fit for...Ch. 14.5 - In Exercises 19 22, find the line of best fit for...Ch. 14.5 - In Example 3, we found the absolute value of the...Ch. 14.5 - Prob. 24ECh. 14.5 - Prob. 25ECh. 14.5 - Prob. 26ECh. 14.5 - Prob. 27ECh. 14.CR - Prob. 1CRCh. 14.CR - Prob. 2CRCh. 14.CR - Prob. 3CRCh. 14.CR - Prob. 4CRCh. 14.CR - The lists represent the ages of actors M and...Ch. 14.CR - Prob. 6CRCh. 14.CR - Prob. 7CRCh. 14.CR - Prob. 8CRCh. 14.CR - Prob. 9CRCh. 14.CR - Prob. 10CRCh. 14.CR - Prob. 11CRCh. 14.CR - Prob. 12CRCh. 14.CR - Prob. 13CRCh. 14.CR - Prob. 14CRCh. 14.CR - Prob. 15CRCh. 14.CR - Prob. 16CRCh. 14.CR - Prob. 17CRCh. 14.CR - State what kind of correlation, if any, is...Ch. 14.CR - Prob. 19CRCh. 14.CT - Prob. 1CTCh. 14.CT - Prob. 2CTCh. 14.CT - Prob. 3CTCh. 14.CT - Prob. 4CTCh. 14.CT - Prob. 5CTCh. 14.CT - Prob. 6CTCh. 14.CT - Prob. 7CTCh. 14.CT - Prob. 8CTCh. 14.CT - Prob. 9CTCh. 14.CT - Prob. 10CTCh. 14.CT - Prob. 11CTCh. 14.CT - Prob. 12CTCh. 14.CT - Prob. 13CTCh. 14.CT - Prob. 14CTCh. 14.CT - Prob. 15CTCh. 14.CT - Prob. 16CTCh. 14.CT - Prob. 17CTCh. 14.CT - Prob. 18CT
Knowledge Booster


Learn more about
Need a deep-dive on the concept behind this application? Look no further. Learn more about this topic, subject and related others by exploring similar questions and additional content below.Similar questions
- Does Table 1 represent a linear function? If so, finda linear equation that models the data.arrow_forwardUse this data for the exercises that follow: In 2013, there were roughly 317 million citizens in the United States, and about 40 million were elderly (aged 65 and over).[34] 60. It is predicted that by 2030, one in five U.S. citizens will be elderly. How much greater will the chances of meeting an elderly person be at that time? What policy changes do you foresee if these statistics hold true?arrow_forwardsection 4.1 #30 In Exercises 25–30, determine whether the association between the two variables is positive or negative. Weekly ice cream sales and weekly average temperaturearrow_forward
- Q. Table provided gives data on gross domestic product (GDP) for the United States for the years 1959–2005. a. Plot the GDP data in current and constant (i.e., 2000) dollars against time. b. Letting Y denote GDP and X time (measured chronologically starting with 1 for 1959, 2 for 1960, through 47 for 2005), see if the following model fits the GDP data: Yt = β1 + β2 Xt + ut Estimate this model for both current and constant-dollar GDP. c. How would you interpret β2? d. If there is a difference between β2 estimated for current-dollar GDP and that estimated for constant-dollar GDP, what explains the difference? e. From your results what can you say about the nature of inflation in the United States over the sample period?arrow_forwardHeart rate during laughter. Laughter is often called “the best medicine,” since studies have shown that laughter can reduce muscle tension and increase oxygenation of the blood. In the International Journal of Obesity (Jan. 2007), researchers at Vanderbilt University investigated the physiological changes that accompany laughter. Ninety subjects (18–34 years old) watched film clips designed to evoke laughter. During the laughing period, the researchers measured the heart rate (beats per minute) of each subject, with the following summary results: Mean = 73.5, Standard Deviation = 6. n=90 (we can treat this as a large sample and use z) It is well known that the mean resting heart rate of adults is 71 beats per minute. Based on the research on laughter and heart rate, we would expect subjects to have a higher heart beat rate while laughing.Construct 95% Confidence interval using z value. What is the lower bound of CI? a) Calculate the value of the test statistic.(z*) b) If…arrow_forwardExercise 3.4arrow_forward
- DATAfile: TelevisionViewing Nielsen tracks the amount of time that people spend consuming media content across different platforms (digital, audio, television) in the United States. Nielsen has found that traditional television viewing habits vary based on the age of the consumer as an increasing number of people consume media through streaming devices.† The following data represent the weekly traditional TV viewing hours in 2016 for a sample of 14 people aged 18–34 and 12 people aged 35–49. (Round your answers to two decimal places.) Viewers aged 18–34 24.2 21.0 17.8 19.6 23.4 19.1 14.6 27.1 19.2 18.3 22.9 23.4 17.3 20.5 Viewers aged 35–49 24.9 34.9 35.8 31.9 35.4 29.9 30.9 36.7 36.2 33.8 29.5 30.8 (a) Compute the mean and median weekly hours of traditional TV viewed by those aged 18–34. mean hrmedian hr (b) Compute the mean and median weekly hours of traditional TV viewed by those aged 35–49. (Round your mean to two decimal places.) mean…arrow_forwardThe file P02_26.xlsx lists sales (in millions of dollars) of Dell Computer during the period 1987–1997 (where year 1 corresponds to 1987). Year Sales 1 69 2 159 3 258 4 389 5 546 6 890 7 2014 8 2873 9 3475 10 5296 11 7759 a. Fit a power and an exponential trend curve to these data. Which fits the data better? b. Use your part a answer to predict 1999 sales for Dell. c. Use your part a answer to describe how the sales of Dell have grown from year to year.arrow_forwardThe table below shows the number of state-registered automatic weapons and the murder rate for several Northwestern states. * | 11.3 2.7 0.5 8.1 y 13.5 10.7| 9.7 7.1 6.7 3.6 2.4 2.2 6.4 5.8 6.6 4.8 x = thousands of automatic weapons y = murders per 100,000 residents This data can be modeled by the equation ŷ = 0.81r + 4.3. Use this equation to answer the following. A) How many murders per 100,000 residents can be expected in a state with 9.3 thousand automatic weapons? Answer = Round to 3 decimal places. B) How many murders per 100,000 residents can be expected in a state with 5.5 thousand automatic weapons? Answer = Round to 3 decimal places.arrow_forward
- Nielsen tracks the amount of time that people spend consuming media content across different platforms (digital, audio, television) in the United States. Nielsen has found that traditional television viewing habits vary based on the age of the consumer as an increasing number of people consume media through streaming devices.† The following data represent the weekly traditional TV viewing hours in 2016 for a sample of 14 people aged 18–34 and 12 people aged 35–49. (Round your answers to two decimal places.) Viewers aged 18–34 24.2 21.0 17.8 19.6 23.4 19.1 14.6 27.1 19.2 18.3 22.9 23.4 17.3 20.5 Viewers aged 35–49 24.9 34.9 35.8 31.9 35.4 29.9 30.9 36.7 36.2 33.8 29.5 30.8 (a) Compute the mean and median weekly hours of traditional TV viewed by those aged 18–34.arrow_forwardThe table below is the number of employees owned by Islamic Commercial Banks (BUS) in 2011 – 2020 obtained from the publication of Sharia Banking Statistics for several years. From the data, answer the following question: Make a trend equation and determine the estimated number of workers in 2021. What can you explain from the trend equation.arrow_forwardThe table shows the number of accidents, fatalities, hours and miles flew for U.S. airlines. Year Accidents Fatalities Hours flown Miles flown 2000 59 98 16.7 million 7.1 billions 2005 36 28 18.7 7.8 2010 29 0 17.2 7.3 2015 25 0 17.4 7.6 a. Compute the accident rate per million hours flown in 2000 and 2015. By this measure, has travel on U.S. airlines become safer? b. Compute the accident rate per billion miles flown in 2000 and 2015. By this measure, has travel on U.S. airlines become safer?arrow_forward
arrow_back_ios
SEE MORE QUESTIONS
arrow_forward_ios
Recommended textbooks for you
 Big Ideas Math A Bridge To Success Algebra 1: Stu...AlgebraISBN:9781680331141Author:HOUGHTON MIFFLIN HARCOURTPublisher:Houghton Mifflin Harcourt
 Glencoe Algebra 1, Student Edition, 9780079039897...AlgebraISBN:9780079039897Author:CarterPublisher:McGraw Hill
 Algebra & Trigonometry with Analytic GeometryAlgebraISBN:9781133382119Author:SwokowskiPublisher:Cengage
Big Ideas Math A Bridge To Success Algebra 1: Stu...
Algebra
ISBN:9781680331141
Author:HOUGHTON MIFFLIN HARCOURT
Publisher:Houghton Mifflin Harcourt
Glencoe Algebra 1, Student Edition, 9780079039897...
Algebra
ISBN:9780079039897
Author:Carter
Publisher:McGraw Hill
Algebra & Trigonometry with Analytic Geometry
Algebra
ISBN:9781133382119
Author:Swokowski
Publisher:Cengage
What Are Research Ethics?; Author: HighSchoolScience101;https://www.youtube.com/watch?v=nX4c3V23DZI;License: Standard YouTube License, CC-BY
What is Ethics in Research - ethics in research (research ethics); Author: Chee-Onn Leong;https://www.youtube.com/watch?v=W8Vk0sXtMGU;License: Standard YouTube License, CC-BY