
Mathematics All Around (6th Edition)
6th Edition
ISBN: 9780134434681
Author: Tom Pirnot
Publisher: PEARSON
expand_more
expand_more
format_list_bulleted
Videos
Textbook Question
Chapter 14.5, Problem 19E
In Exercises 19 –22, find the line of best fit for the data in the specified exercise.
Exercise 15
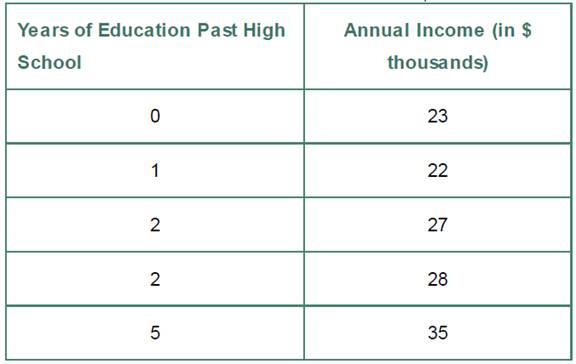
15. The following table lists the number of years of education past high school and the annual income of five people.
Expert Solution & Answer
Want to see the full answer?
Check out a sample textbook solution
Students have asked these similar questions
Using the data in Table 6–11, calculate a 3-month moving average forecastfor month 12.
Using the data in Table 6–11, calculate a 3-month moving average forecast for month 12.
DATAfile: TelevisionViewing
Nielsen tracks the amount of time that people spend consuming media content across different platforms (digital, audio, television) in the United States. Nielsen has found that traditional television viewing habits vary based on the age of the consumer as an increasing number of people consume media through streaming devices.† The following data represent the weekly traditional TV viewing hours in 2016 for a sample of 14 people aged 18–34 and 12 people aged 35–49. (Round your answers to two decimal places.)
Viewers aged 18–34
24.2
21.0
17.8
19.6
23.4
19.1
14.6
27.1
19.2
18.3
22.9
23.4
17.3
20.5
Viewers aged 35–49
24.9
34.9
35.8
31.9
35.4
29.9
30.9
36.7
36.2
33.8
29.5
30.8
(a)
Compute the mean and median weekly hours of traditional TV viewed by those aged 18–34.
mean hrmedian hr
(b)
Compute the mean and median weekly hours of traditional TV viewed by those aged 35–49. (Round your mean to two decimal places.)
mean…
Chapter 14 Solutions
Mathematics All Around (6th Edition)
Ch. 14.1 - Sharpening Your Skills. In Exercises 1 and 2,...Ch. 14.1 - Sharpening Your Skills. In Exercises 1 and 2,...Ch. 14.1 - Sharpening Your Skills. In Exercises 3 and 4,...Ch. 14.1 - Sharpening Your Skills. In Exercises 3 and 4,...Ch. 14.1 - Sharpening Your Skills. In Exercises 5 and 6,...Ch. 14.1 - Sharpening Your Skills. In Exercises 5 and 6,...Ch. 14.1 - Prob. 7ECh. 14.1 - Sharpening Your Skills. In Exercises 7 and 8,...Ch. 14.1 - Prob. 9ECh. 14.1 - Sharpening Your Skills. In Exercises 9 and 10,...
Ch. 14.1 - Prob. 11ECh. 14.1 - Prob. 12ECh. 14.1 - Applying What Youve Learned. Customers at...Ch. 14.1 - Applying What Youve Learned. Scheduling a rec...Ch. 14.1 - Applying What Youve Learned. Data similar to that...Ch. 14.1 - Applying What Youve Learned. Data similar to that...Ch. 14.1 - Comparing wage data. The following bar graphs...Ch. 14.1 - Applying What Youve Lerarned. Comparing wage data....Ch. 14.1 - Applying What Youve Learned. Comparing wage data....Ch. 14.1 - Applying What Youve Learned. Comparing wage data....Ch. 14.1 - Applying What Youve Learned. Comparing wage data....Ch. 14.1 - Prob. 22ECh. 14.1 - Prob. 23ECh. 14.1 - Prob. 24ECh. 14.1 - Prob. 25ECh. 14.1 - For Exercises 23 26, use the four graphs of the...Ch. 14.1 - Applying What Youve Learned. Comparing training...Ch. 14.1 - Applying What Youve Learned. Comparing weight-loss...Ch. 14.1 - Applying What Youve Learned. Super Bowl scores....Ch. 14.1 - Applying What Youve Learned. Law School Aptitude...Ch. 14.1 - In Exercises 31 34, first group the data using an...Ch. 14.1 - Applying What Youve Learned. In Exercises 31 34,...Ch. 14.1 - In Exercises 31 34, first group the data using an...Ch. 14.1 - Applying What Youve Learned. In Exercises 31 34,...Ch. 14.1 - Communicating Mathematics What is the difference...Ch. 14.1 - Communicating Mathematics If you are using a bar...Ch. 14.1 - Communicating Mathematics What is the difference...Ch. 14.1 - Communicating Mathematics What do you see as an...Ch. 14.1 - Challenge Yourself How might you present three...Ch. 14.1 - Challenge Yourself 42. The following table is an...Ch. 14.2 - Prob. 1ECh. 14.2 - Prob. 2ECh. 14.2 - Sharpening Your Skills Find the mean, median, and...Ch. 14.2 - Prob. 4ECh. 14.2 - Prob. 5ECh. 14.2 - Prob. 6ECh. 14.2 - Prob. 7ECh. 14.2 - Prob. 8ECh. 14.2 - Prob. 9ECh. 14.2 - Prob. 10ECh. 14.2 - Prob. 11ECh. 14.2 - Prob. 12ECh. 14.2 - Prob. 13ECh. 14.2 - Prob. 14ECh. 14.2 - Prob. 15ECh. 14.2 - Prob. 16ECh. 14.2 - In Exercises 1720, a give the five-number summary...Ch. 14.2 - Prob. 18ECh. 14.2 - In Exercises 1720, a give the five-number summary...Ch. 14.2 - In Exercises 1720, a give the five-number summary...Ch. 14.2 - In Exercises 2128, find the mean, median, and mode...Ch. 14.2 - In Exercises 2128, find the mean, median, and mode...Ch. 14.2 - In Exercises 2128, find the mean, median, and mode...Ch. 14.2 - In Exercises 2128, find the mean, median, and mode...Ch. 14.2 - In Exercises 2128, find the mean, median, and mode...Ch. 14.2 - In Exercises 2128, find the mean, median, and mode...Ch. 14.2 - In Exercises 2128, find the mean, median, and mode...Ch. 14.2 - In Exercises 2128, find the mean, median, and mode...Ch. 14.2 - Many colleges assign numerical points to grades as...Ch. 14.2 - Prob. 30ECh. 14.2 - Exam scores. Izzy had an 84 and an 86 on his first...Ch. 14.2 - Prob. 32ECh. 14.2 - Prob. 33ECh. 14.2 - Prob. 34ECh. 14.2 - Exam scores. Assume that in your History of Film...Ch. 14.2 - Prob. 36ECh. 14.2 - Prob. 37ECh. 14.2 - Prob. 38ECh. 14.2 - Prob. 39ECh. 14.2 - Example 6 Using Stem-and-Leaf Home Run Records...Ch. 14.2 - Prob. 41ECh. 14.2 - Prob. 42ECh. 14.2 - Prob. 43ECh. 14.2 - Prob. 44ECh. 14.2 - Prob. 45ECh. 14.2 - Prob. 46ECh. 14.2 - Prob. 47ECh. 14.2 - A college placement office has made a comparative...Ch. 14.2 - Prob. 49ECh. 14.2 - Prob. 50ECh. 14.2 - Give three separate real-life examples in which...Ch. 14.2 - Which measure of central tendency do you think is...Ch. 14.2 - Manipulating data. Choose some set of data...Ch. 14.2 - Analyzing misleading graphs. Find a graph in the...Ch. 14.2 - Prob. 55ECh. 14.2 - Prob. 56ECh. 14.2 - Prob. 57ECh. 14.2 - Prob. 58ECh. 14.2 - Prob. 59ECh. 14.2 - Prob. 60ECh. 14.2 - Prob. 61ECh. 14.2 - Prob. 62ECh. 14.2 - Prob. 63ECh. 14.2 - Prob. 64ECh. 14.2 - Prob. 65ECh. 14.3 - Sharpening Your Skills Find the range, mean, and...Ch. 14.3 - Sharpening Your Skills Find the range, mean, and...Ch. 14.3 - Sharpening Your Skills Find the range, mean, and...Ch. 14.3 - Sharpening Your Skills Find the range, mean, and...Ch. 14.3 - Sharpening Your Skills Find the range, mean, and...Ch. 14.3 - Sharpening Your Skills Find the range, mean, and...Ch. 14.3 - Sharpening Your Skills Find the range, mean, and...Ch. 14.3 - Sharpening Your Skills Find the range, mean, and...Ch. 14.3 - Prob. 9ECh. 14.3 - Prob. 10ECh. 14.3 - Prob. 11ECh. 14.3 - Prob. 12ECh. 14.3 - Prob. 13ECh. 14.3 - Prob. 14ECh. 14.3 - Prob. 15ECh. 14.3 - Prob. 16ECh. 14.3 - Prob. 17ECh. 14.3 - Prob. 18ECh. 14.3 - Prob. 19ECh. 14.3 - Applying What Youve Learned Summarizing age data....Ch. 14.3 - Prob. 21ECh. 14.3 - Prob. 22ECh. 14.3 - Prob. 23ECh. 14.3 - Prob. 24ECh. 14.3 - Prob. 25ECh. 14.3 - Prob. 26ECh. 14.3 - Prob. 27ECh. 14.3 - Prob. 28ECh. 14.3 - Prob. 29ECh. 14.3 - Prob. 30ECh. 14.3 - In Exercises 31 and 32, we present information on...Ch. 14.3 - In Exercises 31 and 32, we present information on...Ch. 14.3 - Human resources. As the manager of the human...Ch. 14.3 - Prob. 34ECh. 14.3 - Prob. 35ECh. 14.3 - Prob. 36ECh. 14.3 - Prob. 37ECh. 14.3 - Prob. 38ECh. 14.3 - Laptop batteries. A particular brand of laptop was...Ch. 14.3 - Study times. A group of students were sampled with...Ch. 14.3 - Prob. 41ECh. 14.3 - Prob. 42ECh. 14.3 - Prob. 43ECh. 14.3 - Use the following graphs for Exercise 44 a. Which...Ch. 14.3 - Prob. 45ECh. 14.3 - Prob. 46ECh. 14.3 - Prob. 47ECh. 14.3 - Prob. 48ECh. 14.4 - Assume that the distribution in Exercises 1 6 has...Ch. 14.4 - Assume that the distribution in Exercises 1 6 has...Ch. 14.4 - Assume that the distribution in Exercises 1 6 has...Ch. 14.4 - Assume that the distribution in Exercises 1 6 has...Ch. 14.4 - Assume that the distribution in Exercises 1 6 has...Ch. 14.4 - Assume that the distribution in Exercises 1 6 has...Ch. 14.4 - Assume that the distribution in Exercises 7 12...Ch. 14.4 - Assume that the distribution in Exercises 7 12...Ch. 14.4 - Assume that the distribution in Exercises 7 12...Ch. 14.4 - Assume that the distribution in Exercises 7 12...Ch. 14.4 - Assume that the distribution in Exercises 7 12...Ch. 14.4 - Assume that the distribution in Exercises 7 12...Ch. 14.4 - Use the following graph of the standard normal...Ch. 14.4 - Use the following graph of the standard normal...Ch. 14.4 - Use Table 14.19 to find the percent of the area...Ch. 14.4 - Use Table 14.19 to find the percent of the area...Ch. 14.4 - Use Table 14.19 to find the percent of the area...Ch. 14.4 - Prob. 18ECh. 14.4 - Prob. 19ECh. 14.4 - Prob. 20ECh. 14.4 - Prob. 21ECh. 14.4 - Prob. 22ECh. 14.4 - Use Table 14.19 to find the percent of the area...Ch. 14.4 - Prob. 24ECh. 14.4 - Use Table 14.19 to find the percent of the area...Ch. 14.4 - Use Table 14.19 to find the percent of the area...Ch. 14.4 - Use Table 14.19 to find the percent of the area...Ch. 14.4 - Prob. 28ECh. 14.4 - Use Table 14.19 to find the percent of the area...Ch. 14.4 - Prob. 30ECh. 14.4 - Use Table 14.19 to find the percent of the area...Ch. 14.4 - Prob. 32ECh. 14.4 - Use Table 14.19 to find the percent of the area...Ch. 14.4 - Prob. 34ECh. 14.4 - Prob. 35ECh. 14.4 - In Exercises 35 - 40, we give you a mean, a...Ch. 14.4 - Prob. 37ECh. 14.4 - Prob. 38ECh. 14.4 - Prob. 39ECh. 14.4 - Prob. 40ECh. 14.4 - Prob. 41ECh. 14.4 - In Exercises 41 - 46, we give you a mean, a...Ch. 14.4 - Prob. 43ECh. 14.4 - Prob. 44ECh. 14.4 - Prob. 45ECh. 14.4 - Prob. 46ECh. 14.4 - Prob. 47ECh. 14.4 - Prob. 48ECh. 14.4 - Prob. 49ECh. 14.4 - Prob. 50ECh. 14.4 - Prob. 51ECh. 14.4 - Prob. 52ECh. 14.4 - Prob. 53ECh. 14.4 - Prob. 54ECh. 14.4 - Prob. 55ECh. 14.4 - Prob. 56ECh. 14.4 - Prob. 57ECh. 14.4 - Prob. 58ECh. 14.4 - Prob. 59ECh. 14.4 - Prob. 60ECh. 14.4 - Prob. 61ECh. 14.4 - Prob. 62ECh. 14.4 - Prob. 63ECh. 14.4 - Weight lifting.In a power lifting competition the...Ch. 14.4 - Strength of cables.A certain type of cable has a...Ch. 14.4 - Prob. 66ECh. 14.4 - Prob. 67ECh. 14.4 - Prob. 68ECh. 14.4 - Prob. 69ECh. 14.4 - Prob. 70ECh. 14.4 - Prob. 71ECh. 14.4 - Prob. 72ECh. 14.4 - Prob. 73ECh. 14.4 - Prob. 74ECh. 14.4 - Analyzing the SATs. Assume that the math SAT...Ch. 14.4 - Prob. 76ECh. 14.4 - Prob. 77ECh. 14.4 - Prob. 78ECh. 14.4 - Prob. 79ECh. 14.4 - Prob. 80ECh. 14.4 - Prob. 81ECh. 14.4 - Prob. 82ECh. 14.4 - Prob. 83ECh. 14.4 - Prob. 84ECh. 14.4 - Prob. 85ECh. 14.4 - Prob. 86ECh. 14.4 - If a distribution has a mean of 40 and a standard...Ch. 14.4 - Prob. 88ECh. 14.4 - Prob. 89ECh. 14.4 - Prob. 90ECh. 14.5 - In Exercises 1 and 2, state what kind of...Ch. 14.5 - In Exercises 1 and 2, state what kind of...Ch. 14.5 - For Exercises 3 6, do the following: a. Plot the...Ch. 14.5 - Prob. 4ECh. 14.5 - Prob. 5ECh. 14.5 - Prob. 6ECh. 14.5 - Prob. 7ECh. 14.5 - Prob. 8ECh. 14.5 - Prob. 9ECh. 14.5 - Prob. 10ECh. 14.5 - Prob. 11ECh. 14.5 - Prob. 12ECh. 14.5 - In Exercises 11 14, find the line of best fit for...Ch. 14.5 - Prob. 14ECh. 14.5 - Prob. 15ECh. 14.5 - Prob. 16ECh. 14.5 - Prob. 17ECh. 14.5 - Prob. 18ECh. 14.5 - In Exercises 19 22, find the line of best fit for...Ch. 14.5 - In Exercises 19 22, find the line of best fit for...Ch. 14.5 - In Exercises 19 22, find the line of best fit for...Ch. 14.5 - In Exercises 19 22, find the line of best fit for...Ch. 14.5 - In Example 3, we found the absolute value of the...Ch. 14.5 - Prob. 24ECh. 14.5 - Prob. 25ECh. 14.5 - Prob. 26ECh. 14.5 - Prob. 27ECh. 14.CR - Prob. 1CRCh. 14.CR - Prob. 2CRCh. 14.CR - Prob. 3CRCh. 14.CR - Prob. 4CRCh. 14.CR - The lists represent the ages of actors M and...Ch. 14.CR - Prob. 6CRCh. 14.CR - Prob. 7CRCh. 14.CR - Prob. 8CRCh. 14.CR - Prob. 9CRCh. 14.CR - Prob. 10CRCh. 14.CR - Prob. 11CRCh. 14.CR - Prob. 12CRCh. 14.CR - Prob. 13CRCh. 14.CR - Prob. 14CRCh. 14.CR - Prob. 15CRCh. 14.CR - Prob. 16CRCh. 14.CR - Prob. 17CRCh. 14.CR - State what kind of correlation, if any, is...Ch. 14.CR - Prob. 19CRCh. 14.CT - Prob. 1CTCh. 14.CT - Prob. 2CTCh. 14.CT - Prob. 3CTCh. 14.CT - Prob. 4CTCh. 14.CT - Prob. 5CTCh. 14.CT - Prob. 6CTCh. 14.CT - Prob. 7CTCh. 14.CT - Prob. 8CTCh. 14.CT - Prob. 9CTCh. 14.CT - Prob. 10CTCh. 14.CT - Prob. 11CTCh. 14.CT - Prob. 12CTCh. 14.CT - Prob. 13CTCh. 14.CT - Prob. 14CTCh. 14.CT - Prob. 15CTCh. 14.CT - Prob. 16CTCh. 14.CT - Prob. 17CTCh. 14.CT - Prob. 18CT
Knowledge Booster


Learn more about
Need a deep-dive on the concept behind this application? Look no further. Learn more about this topic, subject and related others by exploring similar questions and additional content below.Similar questions
- Use this data for the exercises that follow: In 2013, there were roughly 317 million citizens in the United States, and about 40 million were elderly (aged 65 and over).[34] 60. It is predicted that by 2030, one in five U.S. citizens will be elderly. How much greater will the chances of meeting an elderly person be at that time? What policy changes do you foresee if these statistics hold true?arrow_forwardComplete Part D A recent issue of the AARP Bulletin reported that the average weekly pay for a woman with a high school degree is $520 (AARP Bulletin, January–February, 2010). Suppose you would like to determine if the average weekly pay for all working women is significantly greater than that for women with a high school degree. Data providing the weekly pay for a sample of 50 working women are available in the file named WeeklyPay. These data are consistent with the findings reported in the AARP article. Complete D null hyposthesis: H(o)=520Alternative hypothesis: H(a): greater then 520 sample mean=637.94 the test statistic = 5.62 p-value=0.00 Using a=.05, we would reject the null hypothesis. D. Repeat the hypothesis test using the critical value approach. 582 333 759 633 629 523 320 685 599 753 553 641 290 800 696 627 679 667 542 619 950 614 548 570 678 697 750 569…arrow_forward2.62 For the period 2001–2008, the Bristol-Myers Squibb Company, Inc. reported the following amounts (in billions of dollars) for (1) net sales and (2) advertising and product promotion. The data are also in the file XR02062. Source: Bristol-Myers Squibb Company, Annual Reports, 2005, 2008. Year Net Sales Advertising/Promotion 2001 $16.612 $1.201 2002 16.208 1.143 2003 18.653 1.416 2004 19.380 1.411 2005 19.207 1.476 2006 16.208 1.304 2007 18.193 1.415 2008 20.597 1.550 For these data, construct a line graph that shows both net sales and expenditures for advertising/product promotion over time. Some would suggest that increases in advertising should be accompanied by increases in sales. Does your line graph support this?arrow_forward
- Family Heights. In Exercises 1–5, use the following heights (in.) The data are matched so that each column consists of heights from the same family. Scatterplot Construct a scatterplot of the father/son heights, then interpret it.arrow_forwardThe accompanying table represents the average new home size, in square feet, in a country over various years. Construct a display that best represents these data.arrow_forwardThe table below is the number of employees owned by Islamic Commercial Banks (BUS) in 2011 – 2020 obtained from the publication of Sharia Banking Statistics for several years. From the data, answer the following question: Make a trend equation and determine the estimated number of workers in 2021. What can you explain from the trend equation.arrow_forward
- Exercise 5: Index Numbers Statistica displayed the following chart of the most dangerous jobs in America during 2020. The data is sourced from the U.S. Bureau of Labor Statistics and show the number of deaths on the job per 100,000 workers.arrow_forwardThe data below represent the number of streaming hours listened to per day by a sample of 9 people. Findarrow_forwardThe table shows the historical in-state tuition rates for the University of Kalamazoo. Use the data to answer the questions and round your answers to two decimal places. Academic year Rate of tuition for one semester 2008–2009 $3,812 2009–2010 $4,002 2010–2011 $4,441 2011–2012 $4,905 2012–2013 $5,181 What is the percentage increase in tuition from the 2008–2009 school year to the 2012–2013 school year?arrow_forward
arrow_back_ios
SEE MORE QUESTIONS
arrow_forward_ios
Recommended textbooks for you

 Big Ideas Math A Bridge To Success Algebra 1: Stu...AlgebraISBN:9781680331141Author:HOUGHTON MIFFLIN HARCOURTPublisher:Houghton Mifflin Harcourt
 Calculus For The Life SciencesCalculusISBN:9780321964038Author:GREENWELL, Raymond N., RITCHEY, Nathan P., Lial, Margaret L.Publisher:Pearson Addison Wesley,
 Holt Mcdougal Larson Pre-algebra: Student Edition...AlgebraISBN:9780547587776Author:HOLT MCDOUGALPublisher:HOLT MCDOUGAL
Big Ideas Math A Bridge To Success Algebra 1: Stu...
Algebra
ISBN:9781680331141
Author:HOUGHTON MIFFLIN HARCOURT
Publisher:Houghton Mifflin Harcourt
Calculus For The Life Sciences
Calculus
ISBN:9780321964038
Author:GREENWELL, Raymond N., RITCHEY, Nathan P., Lial, Margaret L.
Publisher:Pearson Addison Wesley,
Holt Mcdougal Larson Pre-algebra: Student Edition...
Algebra
ISBN:9780547587776
Author:HOLT MCDOUGAL
Publisher:HOLT MCDOUGAL
What Are Research Ethics?; Author: HighSchoolScience101;https://www.youtube.com/watch?v=nX4c3V23DZI;License: Standard YouTube License, CC-BY
What is Ethics in Research - ethics in research (research ethics); Author: Chee-Onn Leong;https://www.youtube.com/watch?v=W8Vk0sXtMGU;License: Standard YouTube License, CC-BY