
Concept explainers
Videos
Interpretation:
Concept Introduction:
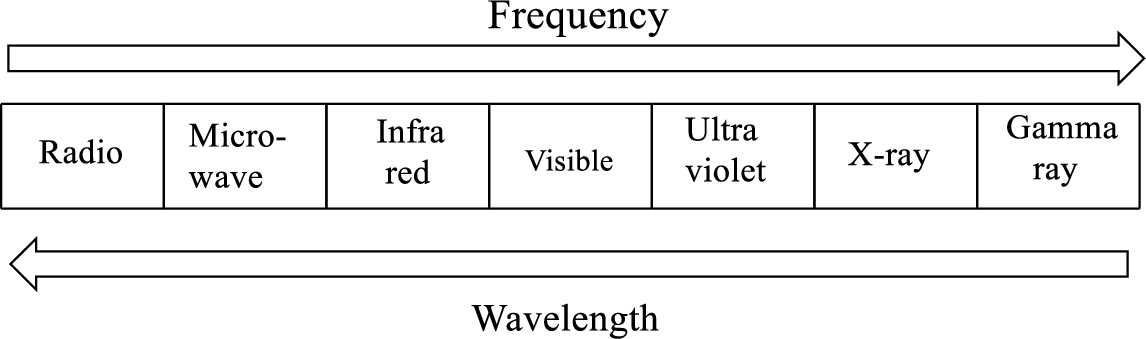
Electromagnetic spectrum is a range of all types of electromagnetic radiation.
- IR Spectroscopy: The bonds between atoms in the molecule stretch and bend, absorbing IR energy and creating the IR spectrum.
- IR spectroscopy is used to identify the functional groups in a compound. The frequencies in IR spectroscopy are reported using a unit called wavenumber and it is represented by
Carbonyl group: The functional group that contains carbon atom which is doubly bonded with the oxygen atom. The characteristic IR signal for
Primary and secondary amine:
Primary amine refers to the functional group that contains one nitrogen atom bonded to two hydrogen atoms and one carbon containing group and the secondary amine contains nitrogen bonded to one hydrogen atom and two carbon containing groups.
The characteristic IR signal for
Alcohol functional group: It refers to the functional group that contains one
Want to see the full answer?
Check out a sample textbook solution
Chapter 14 Solutions
Chemistry In Context


- List ALL the significant peaks in the IR spectrum of each molecule below by showing which functional group should have an absorbance at which wave number. They might have more than one functional group.arrow_forwardDetermine the compound (name or structure) from the data. Explain features from each data Molecular formula: C3H8O -Use molecular formula to determine IHD -IR: Identify the presence/absence of five key functional groups -NMR: Analyze this last. Consider multiplicity and peak area to confirm compound -Structure?arrow_forward3. Identify functional groups in the following Fourier Transform Infra-Red (FTIR) spectra for the given chemical structures. Write your answer in the box.arrow_forward
- Analyze the spectra below assign/ label significant peaks and draw the isomers (correct structure of the molecular formula C5H8Oarrow_forwardLable the IR spectrum by labeling each of the major peaks as a functional group. Also list the functional groups in C4H8Oarrow_forwardExplain why these are the correct spectra for the molecules. Identify a specific absorption band which identifies each characteristic functional group of the molecule chosen.arrow_forward
- Examine the IR spectrum in Photo 1. Record the wavenumber for each relevant peak in Data Table 1. Record the bond represented by each relevant peak. Identify the functional groups associated with each bond and record it. Circle the structure(s) on Photo 2 that match the data.arrow_forward2) On spectra 2 are the mass, IR and 13 C and 1 H NMRspectra of an organic compound.a) From these spectra, determine the structure of the molecule. Rememberto ignore the triad in the 13 C NMR spectrum at 7 ppm that comes from theNMR solvent. b) Draw the structure of the molecule and label each hydrogen with a letter(A, B, C...). Then fill in the peak assignment table below. hydrogen chemical shift integration splitting pattern couples toarrow_forwardExplain why this is the correct spectra for these molecules. Identify a specific absorption band which identifies each characteristic functional group of the chosen molecule.arrow_forward
- Examine the IR spectrum. Record the wavenumber for each relevant peak. Record the bond represented by each relevant peak. Identify the functional groups associated with each bond and record it. Circle the structure(s) that match the data recorded.arrow_forwardIR Peaks for different functional group?arrow_forwardAcetyleugnol: Match the peaks to the appropriate number on the structure.arrow_forward
 Organic Chemistry: A Guided InquiryChemistryISBN:9780618974122Author:Andrei StraumanisPublisher:Cengage Learning