
Videos
In Exercises 5–20, assume that the two samples are independent simple random samples selected from
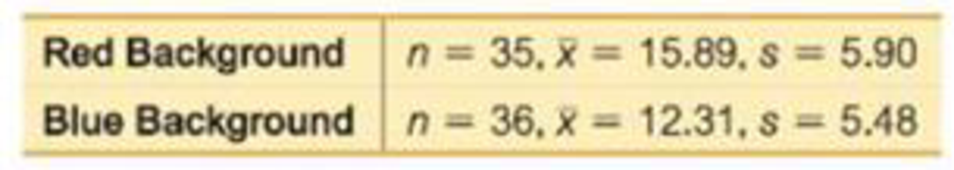
8. Color and Cognition Researchers from the University of British Columbia conducted a study to investigate the effects of color on cognitive tasks. Words were displayed on a computer screen with background colors of red and blue. Results from scores on a test of word recall are given below. Higher scores correspond to greater word recall.
a. Use a 0.05 significance level to test the claim that the samples are from populations with the same mean.
b. Construct a confidence interval appropriate for the hypothesis test in part (a). What is it about the confidence interval that causes us to reach the same conclusion from part (a)?
c. Does the background color appear to have an effect on word recall scores? If so, which color appears to be associated with higher word memory recall scores?

Learn your wayIncludes step-by-step video

Chapter 9 Solutions
Elementary Statistics (13th Edition)
Additional Math Textbook Solutions
Introductory Statistics (2nd Edition)
Basic Business Statistics, Student Value Edition
Intro Stats, Books a la Carte Edition (5th Edition)
Elementary Statistics: Picturing the World (6th Edition)
Essentials of Statistics, Books a la Carte Edition (5th Edition)


- In Exercises 5–20, assume that the two samples are independent simple random samples selected from normally distributed populations, and do not assume that the population standard deviations are equal. (Note: Answers in Appendix D include technology answers based on Formula 9-1 along with “Table” answers based on Table A-3 with df equal to the smaller of n1 − 1 and n2 − 1.) IQ and Lead Exposure Data Set 7 “IQ and Lead” in Appendix B lists full IQ scores for a random sample of subjects with low lead levels in their blood and another random sample of subjects with high lead levels in their blood. The statistics are summarized below. a. Use a 0.05 significance level to test the claim that the mean IQ score of people with low blood lead levels is higher than the mean IQ score of people with high blood lead levels. b. Construct a confidence interval appropriate for the hypothesis test in part (a). c. Does exposure to lead appear to have an effect on IQ scores?arrow_forwardIn Exercises 5–20, assume that the two samples are independent simple random samples selected from normally distributed populations, and do not assume that the population standard deviations are equal. (Note: Answers in Appendix D include technology answers based on Formula 9-1 along with “Table” answers based on Table A-3 with df equal to the smaller of n1 − 1 and n2 − 1.) Are Male Professors and Female Professors Rated Differently? Listed below are student evaluation scores of female professors and male professors from Data Set 17 “Course Evaluations” in Appendix B. Test the claim that female professors and male professors have the same mean evaluation ratings. Does there appear to be a difference?arrow_forwardScenario: Does emotional intelligence vary based on the type of preschool a child attends? A researcher collects data on 300 four-year-olds who attend different local types of preschools. The researcher was able to collect data from four different types of preschools - Montessori, Waldorf, Parent Co-ops, and religious preschools. Emotional intelligence was quantified using the self-report Bar-On EQ-I, which ranges from 0 — 110, and is considered "scale" in nature. Assume data meets all assumptions for a parametric test. Question: What is the null hypothesis for this scenario?arrow_forward
- Scenario: Does emotional intelligence vary based on the type of preschool a child attends? A researcher collects data on 300 four-year-olds who attend different local types of preschools. The researcher was able to collect data from four different types of preschools - Montessori, Waldorf, Parent Co-ops, and religious preschools. Emotional intelligence was quantified using the self-report Bar-On EQ-I, which ranges from 0 — 110, and is considered "scale" in nature. Assume data meets all assumptions for a parametric test. Question: Which of the following best describes the scenario? Between-subjects Within-subjects Mixed designarrow_forwardc) Interpret the statistical significance of these coefficients.arrow_forwardThe article cited in Exercise 4 also investigated the effects of the factors on glucose consumption (in g/L). A single measurement is provided for each combination of factors (in the article, there was some replication). The results are presented in the following table. Glucose Consumption 68.0 -1 -1 -1 -1 -1 77.5 -1 -1 98.0 1. 1. -1 98.0 -1 -1 74.0 -1 77.0 -1 97.0 98.0 Compute estimates of the main effects and the interactions. a. Is it possible to compute an error sum of squares? Explain. Are any of the interactions among the larger effects? If so, which ones? d. Assume that it is known from past experience that the additive model holds. Add the sums of squares for the interactions, and use that result in place of an error sum of squares to test the hypotheses that the main effects are equal to 0. Ъ. C.arrow_forward
- Refer to the data presented in Exercise 2.86. Note that there were 50% more accidents in the 25 to less than 30 age group than in the 20 to less than 25 age group. Does this suggest that the older group of drivers in this city is more accident- prone than the younger group? What other explanation might account for the difference in accident rates?arrow_forwardPlease do iv. Calculate the variance onlyarrow_forwardsection9.2 42a. True or false: If P = 0.08, then a. The result is statistically significant at the α = 0.05 level.arrow_forward
- P -Values. In Exercises 17–20, do the following: a. Identify the hypothesis test as being two-tailed, left-tailed, or right-tailed. b. Find the p -value. (See Figure 8-3 on page 364.) c. Using a significance level of α = 0.05, should we reject H0 or should we fail to reject H0? The test statistic of z = −2.50 is obtained when testing the claim that p < 0.75.arrow_forwardA clinical psychologist is interested in the relationship between testosterone level in married males and the quality of their marital relationship. A study is conducted in which the testosterone levels of eight married men are measured. The eight men also fill out a standardized questionnaire assessing quality of marital relationship. The questionnaire scale is 0–25, with higher numbers indicating better relationships. Testosterone scores are in nanomoles/liter of serum. The data are shown below. Subject Number 1 2 3 4 5 6 7 8 Relationship Score 24 15 15 10 19 11 20 19 Testosterone Level 12 13 19 25 M 16 15 21 a. Determine the least-squares regression line for predicting relationship score from testosterone level. b. What percentage of the variance in relationship score is accounted for by the regression equation? c. Can we conclude that there is a significant relationship between the testosterone level…arrow_forwardThe data in Table 7–6 were collected in a clinical trial to evaluate a new compound designed to improve wound healing in trauma patients. The new compound was com- pared against a placebo. After treatment for 5 days with the new compound or placebo, the extent of wound heal- ing was measured. Is there a difference in the extent of wound healing between the treatments? (Hint: Are treat- ment and the percent wound healing independent?) Run the appropriate test at a 5% level of significance. Can you please show how to do it in excel. Treatment 0-25% 26-50% 51-75% 76-100% New Compound (n=125) 15 37 32 41 Placebo (n=125) 36 45 34 10arrow_forward
 MATLAB: An Introduction with ApplicationsStatisticsISBN:9781119256830Author:Amos GilatPublisher:John Wiley & Sons Inc
 Probability and Statistics for Engineering and th...StatisticsISBN:9781305251809Author:Jay L. DevorePublisher:Cengage Learning
 Statistics for The Behavioral Sciences (MindTap C...StatisticsISBN:9781305504912Author:Frederick J Gravetter, Larry B. WallnauPublisher:Cengage Learning
 Elementary Statistics: Picturing the World (7th E...StatisticsISBN:9780134683416Author:Ron Larson, Betsy FarberPublisher:PEARSON
 The Basic Practice of StatisticsStatisticsISBN:9781319042578Author:David S. Moore, William I. Notz, Michael A. FlignerPublisher:W. H. Freeman
 Introduction to the Practice of StatisticsStatisticsISBN:9781319013387Author:David S. Moore, George P. McCabe, Bruce A. CraigPublisher:W. H. Freeman