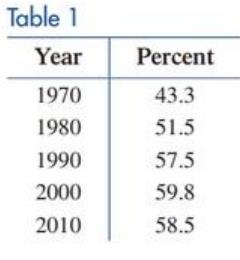
Labor force. Table 1 gives the percentage of the U.S. female population who were members of the civilian labor force in the indicated years. The following transition matrix P is proposed as a model for the data, where L represents females who are in the labor force and L ' represents females who are not in the labor force: Next decade L L ′ Current decade L L ′ .92 .08 .2 .8 = P (A) Let S 0 = .433 .567 , and find S 1 , S 2 , S 3 , and S 4 . Compute the matrices exactly and then round entries to three decimal places. (B) Construct a new table comparing the results from part (A) with the data in Table 1. (C) According to this transition matrix, what percentage of the U.S. female population will be in the labor force in the long run?
Labor force. Table 1 gives the percentage of the U.S. female population who were members of the civilian labor force in the indicated years. The following transition matrix P is proposed as a model for the data, where L represents females who are in the labor force and L ' represents females who are not in the labor force: Next decade L L ′ Current decade L L ′ .92 .08 .2 .8 = P (A) Let S 0 = .433 .567 , and find S 1 , S 2 , S 3 , and S 4 . Compute the matrices exactly and then round entries to three decimal places. (B) Construct a new table comparing the results from part (A) with the data in Table 1. (C) According to this transition matrix, what percentage of the U.S. female population will be in the labor force in the long run?
Solution Summary: The author calculates the matrices, S_1, S2,
Labor force. Table 1 gives the percentage of the U.S. female population who were members of the civilian labor force in the indicated years. The following transition matrix
P
is proposed as a model for the data, where
L
represents females who are in the labor force and
L
'
represents females who are not in the labor force:
Next decade
L
L
′
Current
decade
L
L
′
.92
.08
.2
.8
=
P
(A) Let
S
0
=
.433
.567
, and find
S
1
,
S
2
,
S
3
, and
S
4
. Compute the matrices exactly and then round entries to three decimal places.
(B) Construct a new table comparing the results from part (A) with the data in Table 1.
(C) According to this transition matrix, what percentage of the U.S. female population will be in the labor force in the long run?
Need a deep-dive on the concept behind this application? Look no further. Learn more about this topic, subject and related others by exploring similar questions and additional content below.


 Big Ideas Math A Bridge To Success Algebra 1: Stu...AlgebraISBN:9781680331141Author:HOUGHTON MIFFLIN HARCOURTPublisher:Houghton Mifflin Harcourt
 Calculus For The Life SciencesCalculusISBN:9780321964038Author:GREENWELL, Raymond N., RITCHEY, Nathan P., Lial, Margaret L.Publisher:Pearson Addison Wesley,
 Glencoe Algebra 1, Student Edition, 9780079039897...AlgebraISBN:9780079039897Author:CarterPublisher:McGraw Hill
 Linear Algebra: A Modern IntroductionAlgebraISBN:9781285463247Author:David PoolePublisher:Cengage Learning
 Functions and Change: A Modeling Approach to Coll...AlgebraISBN:9781337111348Author:Bruce Crauder, Benny Evans, Alan NoellPublisher:Cengage Learning