Grade Inflation . The bar graph shows the percentage of UScollege freshmen with an average grade of A in high school. The data displayed by the bar graph can be described by the mathematical model P = 4 x 5 + 25 where x is the number of years after 1980 and p is the percentage of U.S. college freshmen who had an average grade of A in highschool. Use this information to solve Exercises 107-108. 107. a. According to the formula, in 2010, what percentage of U.S. college freshmen had an average grade of A in high school? Does this underestimate or overestimate the percent displayed by the bar graph? By how much? 49. % overestimates by 1% b. If trends shown by the formula continue, project when57% of US. college freshmen will have and an averagegrade of A in high school 2020
Grade Inflation . The bar graph shows the percentage of UScollege freshmen with an average grade of A in high school. The data displayed by the bar graph can be described by the mathematical model P = 4 x 5 + 25 where x is the number of years after 1980 and p is the percentage of U.S. college freshmen who had an average grade of A in highschool. Use this information to solve Exercises 107-108. 107. a. According to the formula, in 2010, what percentage of U.S. college freshmen had an average grade of A in high school? Does this underestimate or overestimate the percent displayed by the bar graph? By how much? 49. % overestimates by 1% b. If trends shown by the formula continue, project when57% of US. college freshmen will have and an averagegrade of A in high school 2020
Solution Summary: The author calculates the percentage of U.S. college freshmen who had an average grade of A in high school in year 2010.
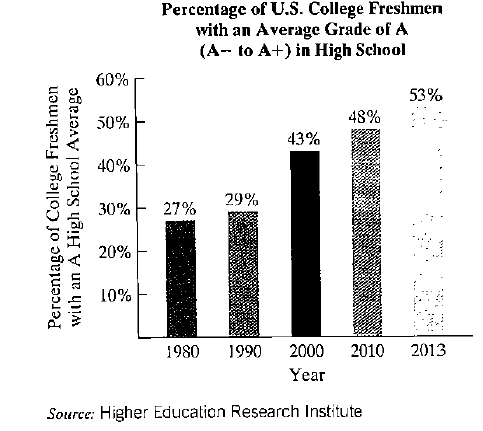
Grade Inflation. The bar graph shows the percentage of UScollege freshmen with an average grade of A in high school.
The data displayed by the bar graph can be described by the mathematical model
P
=
4
x
5
+
25
where x is the number of years after 1980 and p is the percentage of U.S. college freshmen who had an average grade of A in highschool. Use this information to solve Exercises 107-108.
107. a. According to the formula, in 2010, what percentage of U.S. college freshmen had an average grade of A in high school? Does this underestimate or overestimate the percent displayed by the bar graph? By how much? 49. % overestimates by 1%
b. If trends shown by the formula continue, project when57% of US. college freshmen will have and an averagegrade of A in high school 2020
A Survey of Mathematics with Applications (10th Edition) - Standalone book
Knowledge Booster
Learn more about
Need a deep-dive on the concept behind this application? Look no further. Learn more about this topic, subject and related others by exploring similar questions and additional content below.


 Algebra: Structure And Method, Book 1AlgebraISBN:9780395977224Author:Richard G. Brown, Mary P. Dolciani, Robert H. Sorgenfrey, William L. ColePublisher:McDougal Littell
 Algebra & Trigonometry with Analytic GeometryAlgebraISBN:9781133382119Author:SwokowskiPublisher:Cengage
 Holt Mcdougal Larson Pre-algebra: Student Edition...AlgebraISBN:9780547587776Author:HOLT MCDOUGALPublisher:HOLT MCDOUGAL
 College Algebra (MindTap Course List)AlgebraISBN:9781305652231Author:R. David Gustafson, Jeff HughesPublisher:Cengage Learning
 Glencoe Algebra 1, Student Edition, 9780079039897...AlgebraISBN:9780079039897Author:CarterPublisher:McGraw Hill
 Elementary AlgebraAlgebraISBN:9780998625713Author:Lynn Marecek, MaryAnne Anthony-SmithPublisher:OpenStax - Rice University