
Developmental Mathematics (9th Edition)
9th Edition
ISBN: 9780321997173
Author: Marvin L. Bittinger, Judith A. Beecher
Publisher: PEARSON
expand_more
expand_more
format_list_bulleted
Concept explainers
Videos
Question
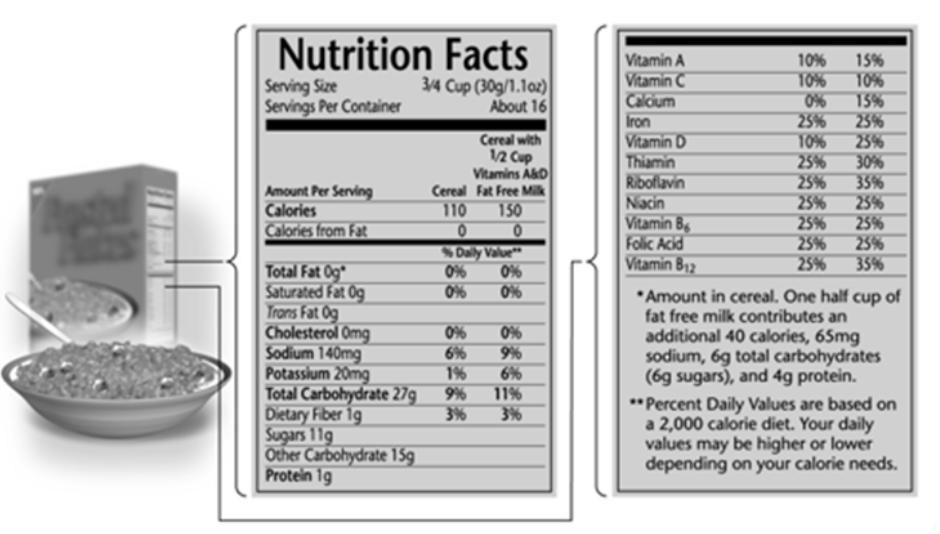
Chapter 5.2, Problem 21ES
To determine
To calculate: The number of calories consumed if a morning bowl of cereals consists of
Expert Solution & Answer
Want to see the full answer?
Check out a sample textbook solution
Students have asked these similar questions
Please help with Worksheet 15.5 #2. Thanks!
A health-conscious company decides to make a trail mix out of almonds, dried cranberries, and chocolate-covered cashews. The nutritional information for these items is
shown in the table below.
Almonds
Cranberries
Cashews
(per 10 pieces)
(per 10 pieces)
(per 10 pieces)
Fat (g)
6.
0,02
Protein (g)
2
3.5
Carbohydrates (g)
8
5.5
For the "hiking" mix, there are 1,000 total pieces of mix. The total amount of protein is 55 g, and the total amount of fat is 131.6 g. If there are the same number of
almonds as cashews, how many pieces of each item are in the trail mix?
almonds
pieces
cranberries
pieces
cashews
pieces
Additional Materials
Please help with Worksheet 15.4 #1. thank you!
Chapter 5 Solutions
Developmental Mathematics (9th Edition)
Ch. 5.1 - Objectives 1.6c and 3.4c:Simplify expressions...Ch. 5.1 - Prob. 2SRCh. 5.1 - Prob. 1DECh. 5.1 - Prob. 2DECh. 5.1 - Prob. 3DECh. 5.1 - Prob. 4DECh. 5.1 - GS Sohas sociology professor included the...Ch. 5.1 - Prob. 6DECh. 5.1 - Prob. 7DECh. 5.1 - Prob. 8DE
Ch. 5.1 - Prob. 9DECh. 5.1 - Prob. 10DECh. 5.1 - Prob. 11DECh. 5.1 - Prob. 12DECh. 5.1 - Prob. 13DECh. 5.1 - Prob. 14DECh. 5.1 - Prob. 15DECh. 5.1 - 16. In a lab, Gina determined the mass, in grams,...Ch. 5.1 - Prob. 1RCCh. 5.1 - Prob. 2RCCh. 5.1 - Prob. 3RCCh. 5.1 - Prob. 4RCCh. 5.1 - Prob. 1ESCh. 5.1 - Prob. 2ESCh. 5.1 - Prob. 3ESCh. 5.1 - Prob. 4ESCh. 5.1 - Prob. 5ESCh. 5.1 - Prob. 6ESCh. 5.1 - Prob. 7ESCh. 5.1 - Prob. 8ESCh. 5.1 - Prob. 9ESCh. 5.1 - Prob. 10ESCh. 5.1 - Prob. 11ESCh. 5.1 - Prob. 12ESCh. 5.1 - Prob. 13ESCh. 5.1 - Prob. 14ESCh. 5.1 - Prob. 15ESCh. 5.1 - Prob. 16ESCh. 5.1 - Grading. To get a B in math, Rich must score an...Ch. 5.1 - Prob. 18ESCh. 5.1 - Prob. 19ESCh. 5.1 - Prob. 20ESCh. 5.1 - Median Home Prices. The following table lists the...Ch. 5.1 - Prob. 22ESCh. 5.1 - Movie Ticket Sales. The following table lists the...Ch. 5.1 - Prob. 24ESCh. 5.1 - Prob. 25ESCh. 5.1 - Prob. 26ESCh. 5.1 - Prob. 27ESCh. 5.1 - Prob. 28ESCh. 5.1 - Prob. 29ESCh. 5.1 - Prob. 30ESCh. 5.1 - Prob. 31ESCh. 5.2 - Objective 2.4d: Multiply using mixed numerals....Ch. 5.2 - Prob. 2SRCh. 5.2 - Use the table in Example 1 to answer Margin...Ch. 5.2 - Prob. 2DECh. 5.2 - Prob. 3DECh. 5.2 - Prob. 4DECh. 5.2 - Prob. 5DECh. 5.2 - Prob. 6DECh. 5.2 - Prob. 7DECh. 5.2 - Prob. 8DECh. 5.2 - Prob. 9DECh. 5.2 - Prob. 10DECh. 5.2 - Prob. 11DECh. 5.2 - Prob. 12DECh. 5.2 - Prob. 13DECh. 5.2 - Prob. 14DECh. 5.2 - Prob. 15DECh. 5.2 - Prob. 1RCCh. 5.2 - Prob. 2RCCh. 5.2 - Prob. 3RCCh. 5.2 - Prob. 4RCCh. 5.2 - Prob. 1ESCh. 5.2 - Prob. 2ESCh. 5.2 - Prob. 3ESCh. 5.2 - Prob. 4ESCh. 5.2 - Prob. 5ESCh. 5.2 - Prob. 6ESCh. 5.2 - Prob. 7ESCh. 5.2 - Prob. 8ESCh. 5.2 - Prob. 9ESCh. 5.2 - Prob. 10ESCh. 5.2 - Prob. 11ESCh. 5.2 - Prob. 12ESCh. 5.2 - Prob. 13ESCh. 5.2 - Prob. 14ESCh. 5.2 - Prob. 15ESCh. 5.2 - Prob. 16ESCh. 5.2 - Prob. 17ESCh. 5.2 - Prob. 18ESCh. 5.2 - Prob. 19ESCh. 5.2 - Prob. 20ESCh. 5.2 - Prob. 21ESCh. 5.2 - Prob. 22ESCh. 5.2 - Prob. 23ESCh. 5.2 - Prob. 24ESCh. 5.2 - Prob. 25ESCh. 5.2 - Prob. 26ESCh. 5.2 - Prob. 27ESCh. 5.2 - Prob. 28ESCh. 5.2 - Prob. 29ESCh. 5.2 - Prob. 30ESCh. 5.2 - Prob. 31ESCh. 5.2 - Prob. 32ESCh. 5.2 - Prob. 33ESCh. 5.2 - Prob. 34ESCh. 5.2 - Prob. 35ESCh. 5.2 - Prob. 36ESCh. 5.2 - Prob. 37ESCh. 5.2 - Prob. 38ESCh. 5.2 - Personal Consumption Expenditures. The following...Ch. 5.2 - Personal Consumption Expenditures. The following...Ch. 5.2 - Prob. 41ESCh. 5.2 - Prob. 42ESCh. 5.2 - Prob. 43ESCh. 5.2 - Prob. 44ESCh. 5.2 - Prob. 1MCRCh. 5.2 - Prob. 2MCRCh. 5.2 - Prob. 3MCRCh. 5.2 - Prob. 4MCRCh. 5.2 - Prob. 5MCRCh. 5.2 - Prob. 6MCRCh. 5.2 - Prob. 7MCRCh. 5.2 - Prob. 8MCRCh. 5.2 - Prob. 9MCRCh. 5.2 - Prob. 10MCRCh. 5.2 - Prob. 11MCRCh. 5.2 - Prob. 12MCRCh. 5.2 - Prob. 13MCRCh. 5.2 - Prob. 14MCRCh. 5.2 - Prob. 15MCRCh. 5.2 - Prob. 16MCRCh. 5.2 - Downsizing. Companies sometimes downsize their...Ch. 5.2 - Prob. 18MCRCh. 5.2 - Prob. 19MCRCh. 5.2 - Prob. 20MCRCh. 5.2 - Prob. 21MCRCh. 5.2 - Prob. 22MCRCh. 5.2 - Prob. 23UTDWCh. 5.2 - Answers to Exercises 23 and 24 can be found on...Ch. 5.3 - Objective 3.1c: Given a pair of numbers in decimal...Ch. 5.3 - Objective 3.1c: Given a pair of numbers in decimal...Ch. 5.3 - Prob. 1DECh. 5.3 - Prob. 2DECh. 5.3 - Prob. 3DECh. 5.3 - Prob. 4DECh. 5.3 - Prob. 5DECh. 5.3 - Prob. 6DECh. 5.3 - Prob. 7DECh. 5.3 - Prob. 8DECh. 5.3 - Prob. 1RCCh. 5.3 - Prob. 2RCCh. 5.3 - Prob. 3RCCh. 5.3 - Prob. 4RCCh. 5.3 - Prob. 1ESCh. 5.3 - Prob. 2ESCh. 5.3 - Prob. 3ESCh. 5.3 - Prob. 4ESCh. 5.3 - Prob. 5ESCh. 5.3 - Prob. 6ESCh. 5.3 - Prob. 7ESCh. 5.3 - Prob. 8ESCh. 5.3 - Prob. 9ESCh. 5.3 - Prob. 10ESCh. 5.3 - Prob. 11ESCh. 5.3 - Prob. 12ESCh. 5.3 - Prob. 13ESCh. 5.3 - Prob. 14ESCh. 5.3 - Prob. 15ESCh. 5.3 - Prob. 16ESCh. 5.3 - Prob. 17ESCh. 5.3 - Prob. 18ESCh. 5.3 - Prob. 19ESCh. 5.3 - Prob. 20ESCh. 5.3 - Prob. 21ESCh. 5.3 - Prob. 22ESCh. 5.3 - Prob. 23ESCh. 5.3 - Prob. 24ESCh. 5.3 - Prob. 25ESCh. 5.3 - Prob. 26ESCh. 5.3 - Prob. 27ESCh. 5.3 - Prob. 28ESCh. 5.3 - Prob. 29ESCh. 5.3 - Prob. 30ESCh. 5.3 - Prob. 31ESCh. 5.3 - Prob. 32ESCh. 5.3 - Prob. 33ESCh. 5.3 - Prob. 34ESCh. 5.3 - Prob. 35ESCh. 5.3 - Prob. 36ESCh. 5.3 - Prob. 37ESCh. 5.3 - Prob. 38ESCh. 5.3 - Prob. 39ESCh. 5.3 - Prob. 40ESCh. 5.3 - Prob. 41ESCh. 5.3 - Prob. 42ESCh. 5.3 - Prob. 43ESCh. 5.3 - Prob. 44ESCh. 5.3 - Prob. 45ESCh. 5.3 - Prob. 46ESCh. 5.3 - Prob. 47ESCh. 5.3 - Prob. 48ESCh. 5.3 - Prob. 49ESCh. 5.3 - Prob. 50ESCh. 5.3 - Prob. 51ESCh. 5.3 - Prob. 52ESCh. 5.3 - Prob. 53ESCh. 5.3 - Prob. 54ESCh. 5.3 - Prob. 55ESCh. 5.3 - Prob. 56ESCh. 5.3 - Prob. 57ESCh. 5.3 - Prob. 58ESCh. 5.3 - Prob. 59ESCh. 5.3 - Prob. 60ESCh. 5.4 - Objective 4.3a: Convert from fraction notation to...Ch. 5.4 - Prob. 2SRCh. 5.4 - Prob. 1DECh. 5.4 - Prob. 2DECh. 5.4 - Prob. 3DECh. 5.4 - Prob. 4DECh. 5.4 - Prob. 1TFSCh. 5.4 - Prob. 2TFSCh. 5.4 - Prob. 3TFSCh. 5.4 - Prob. 4TFSCh. 5.4 - Prob. 5TFSCh. 5.4 - The goal of these matching questions is to...Ch. 5.4 - Prob. 7TFSCh. 5.4 - Prob. 8TFSCh. 5.4 - Prob. 9TFSCh. 5.4 - Prob. 10TFSCh. 5.4 - Prob. 1RCCh. 5.4 - Prob. 2RCCh. 5.4 - Prob. 3RCCh. 5.4 - Prob. 4RCCh. 5.4 - Prob. 5RCCh. 5.4 - Prob. 6RCCh. 5.4 - Prob. 1ESCh. 5.4 - Prob. 2ESCh. 5.4 - Prob. 3ESCh. 5.4 - Prob. 4ESCh. 5.4 - Prob. 5ESCh. 5.4 - Prob. 6ESCh. 5.4 - Prob. 7ESCh. 5.4 - Prob. 8ESCh. 5.4 - Prob. 9ESCh. 5.4 - Prob. 10ESCh. 5 - Complete each statement with the correct term from...Ch. 5 - Prob. 2VRCh. 5 - Prob. 3VRCh. 5 - Prob. 4VRCh. 5 - Prob. 5VRCh. 5 - Prob. 6VRCh. 5 - Prob. 1CORCh. 5 - Prob. 2CORCh. 5 - Prob. 3CORCh. 5 - Prob. 1SGPECh. 5 - 2. Use the table in the example shown above for...Ch. 5 - Which oatmeal has the greatest cost per serving?...Ch. 5 - Prob. 4SGPECh. 5 - Prob. 5SGPECh. 5 - Prob. 6SGPECh. 5 - Use the circle graph at left to answer Exercises 7...Ch. 5 - Use the circle graph at left to answer Exercises 7...Ch. 5 - Prob. 1RECh. 5 - Prob. 2RECh. 5 - Prob. 3RECh. 5 - Prob. 4RECh. 5 - Prob. 5RECh. 5 - Prob. 6RECh. 5 - Prob. 7RECh. 5 - Gas Mileage. A 2012 Mazda Miata does 336 mi of...Ch. 5 - Prob. 9RECh. 5 - Prob. 10RECh. 5 - Prob. 11RECh. 5 - Prob. 12RECh. 5 - Prob. 13RECh. 5 - Prob. 14RECh. 5 - Prob. 15RECh. 5 - Prob. 16RECh. 5 - Prob. 17RECh. 5 - Prob. 18RECh. 5 - Prob. 19RECh. 5 - Prob. 20RECh. 5 - Prob. 21RECh. 5 - Prob. 22RECh. 5 - Prob. 23RECh. 5 - Prob. 24RECh. 5 - Prob. 25RECh. 5 - Prob. 26RECh. 5 - Major League World Series. Except for four years,...Ch. 5 - Prob. 28RECh. 5 - Prob. 29RECh. 5 - Prob. 30RECh. 5 - Prob. 31RECh. 5 - Prob. 32RECh. 5 - Prob. 33RECh. 5 - Prob. 34RECh. 5 - Prob. 35RECh. 5 - Prob. 36RECh. 5 - Prob. 37RECh. 5 - Prob. 38RECh. 5 - Prob. 39RECh. 5 - Prob. 40RECh. 5 - Prob. 41RECh. 5 - Prob. 42RECh. 5 - Prob. 43RECh. 5 - Prob. 44RECh. 5 - Prob. 45RECh. 5 - What is the average of this set of data?...Ch. 5 - Prob. 47RECh. 5 - Prob. 48RECh. 5 - Prob. 49RECh. 5 - Prob. 50RECh. 5 - Prob. 1UTDWCh. 5 - Prob. 2UTDWCh. 5 - Prob. 3UTDWCh. 5 - Prob. 4UTDWCh. 5 - Prob. 5UTDWCh. 5 - Prob. 6UTDWCh. 5 - Prob. 1TCh. 5 - Prob. 2TCh. 5 - Prob. 3TCh. 5 - Prob. 4TCh. 5 - Prob. 5TCh. 5 - Prob. 6TCh. 5 - Prob. 7TCh. 5 - Prob. 8TCh. 5 - Prob. 9TCh. 5 - Prob. 10TCh. 5 - Prob. 11TCh. 5 - Prob. 12TCh. 5 - Prob. 13TCh. 5 - Prob. 14TCh. 5 - Prob. 15TCh. 5 - Prob. 16TCh. 5 - Prob. 17TCh. 5 - Prob. 18TCh. 5 - Prob. 19TCh. 5 - Prob. 20TCh. 5 - Prob. 21TCh. 5 - Prob. 22TCh. 5 - Prob. 23TCh. 5 - Prob. 24TCh. 5 - Prob. 25TCh. 5 - 26. Referring to Exercise 25, consider a family...
Knowledge Booster


Learn more about
Need a deep-dive on the concept behind this application? Look no further. Learn more about this topic, subject and related others by exploring similar questions and additional content below.Similar questions
- Oil ProductionThe following table shows the amount of crude oil in billions of barrels produced in the United States in recent years. Source: U.S. Energy Information Administration. Year Crude Oil Produced 2002 2.097 2003 2.060 2004 1.989 2005 1.893 2006 1.857 2007 1.853 2008 1.830 2009 1.954 2010 2.000 2011 2.063 2012 2.377 In this exercise we are interested in the total amount of crude oil produced over the 10-year period from mid-2002 to mid-2012, using the data for the 11 years above. One approach is to sum up the numbers in the second column, but only count half of the first and last numbers. Give the answer to this calculation. Approximate the amount of crude oil produced over the 10-year period 2002-2012 by taking the average of the left endpoint sum and the right endpoint sum. Explain why this is equivalent to the calculation done in part a. This is also equivalent to a formula known as the trapezoidal rule, discussed in the next chapter. If your calculator has a cubic regression feature, find the best-fitting cubic function for these data, letting t=0 correspond to 2000. Then integrate this equation over the interval [2.12] to estimate the amount of crude oil produced over this time period. Compare with your answer to part a.arrow_forward10.3 #3 Please help. Ty.arrow_forwardI need D,E,F,G,and Harrow_forward
- I need assistance with parts a, b, and c. Because of high tuition costs at state and private universities, enrollments at community colleges have increased dramatically in recent years. The following data show the enrollment (in thousands) for Jefferson Community College for the nine most recent years. Click on the datafile logo to reference the data. Year Period (t) Enrollment(1,000s) 2001 1 6.5 2002 2 8.1 2003 3 8.4 2004 4 10.2 2005 5 12.5 2006 6 13.3 2007 7 13.7 2008 8 17.2 2009 9 18.1 A. Choose the correct time series plot. What type of pattern exists in the data? Positive trend pattern or negative trend pattern B. Use simple linear regression analysis to find the parameters for the line that minimizes MSE for this time series. If required, round your answers to two decimal places. y-intercept, b0 = Slope, b1 = MSE= C. What is the forecast for year 10? Do not round your interim computations and round your final answer to two decimal places.arrow_forward2.3 #4arrow_forwardOn average, how many emails would a person who is 48 years old, receive per day? Emails per Day by Age 40 30 20 10 12 24 36 48 60 72 Age. Average Emails per Dayarrow_forward
- The table below gives adult wine consumption.arrow_forwardWhat do people actually order at Chipotle? How healthy is a normal Chipotle meal? Chipotle and other relatively new healthier menu choices than the traditional fast food outlets like McDonald's, Taco Bell, Burger King, etc. fast casual chains like Shake Shack, Potbelly and Five Guys typically promote themselves as having The recommended daily calorie intake for most adults is 1,600 to 2,400. The histogram below shows the calories in approximately 3,000 meals ordered from Chipotle on Grubhub. Many burritos and burrito bowls end up with 900 to 1,000 calories. Recommended dietary allowance 2,000 calories 6% of meals 5% This small bump is 4% mostly from sides of chips and guacamole. 3% 2% About 2 percent of meals had more than 2,000 calories. 1% 200 400 600 800 1,000 1,200 1,400 1,600 1,800 2,000 2,200 2,400 2,600 2,800 While the histogram not perfectly symmetric (there is mild right skewness), it is close enough to being symmetric and bell-shaped to justify using the 68-95-99.7 rule.…arrow_forwardFind items belowarrow_forward
- Male and female populations of tortoises under 80 years old are represented by age in the table below. Complete parts (a) through (d).arrow_forwardU Meet General Posts Files Class Notebook Assignments Grades Draw View Help Open in Browser v O Tell me what you want to do File Home Insert Black Blue Dark Red Ink Thickness Math Type Marquee Eraser Pen Highlighter Select Green Color Tools Color Style Math Undo According to the AAA Foundation for Traffic Safety, there were 1,300 incidents of road rage in 1991. By 1995, that number had increased by 24%. Which of the following could reasonably be the number of road rage incidents in 1995? а. 318 b. 988 с. 1,612 d. 1,652 е. 3,120 MacBook Air DII DD F4 F5 F8 F9 F10 F11 F12 2$ % へ & * 一 5 6. 7 8. { } R Y G J K L .... ト LLarrow_forwardCan you help with parts c, d, and e please? The flu situation below demonstrates the importance of having good statistical data in order to understand a situation. As of March 7, the following data on the flu were available for California and New York: State Number of positive Flu cases Number of Flu Tests California 11,686 64,639New York 3,050 32,820 Do these data indicate a significantly larger proportion of California's population tests positive for the flu than the proportion of New York's population that tests positive for the flu? a. State the null and alternative hypothesis that would be used to test the claim that a significantly larger proportion of California's population tests positive for the flu than the proportion of of New York's population that tests positive for the flu.b. What is the apporopriate test statistic?c.…arrow_forward
arrow_back_ios
arrow_forward_ios
Recommended textbooks for you
 Calculus For The Life SciencesCalculusISBN:9780321964038Author:GREENWELL, Raymond N., RITCHEY, Nathan P., Lial, Margaret L.Publisher:Pearson Addison Wesley,
 Algebra & Trigonometry with Analytic GeometryAlgebraISBN:9781133382119Author:SwokowskiPublisher:Cengage
Calculus For The Life Sciences
Calculus
ISBN:9780321964038
Author:GREENWELL, Raymond N., RITCHEY, Nathan P., Lial, Margaret L.
Publisher:Pearson Addison Wesley,
Algebra & Trigonometry with Analytic Geometry
Algebra
ISBN:9781133382119
Author:Swokowski
Publisher:Cengage
The Shape of Data: Distributions: Crash Course Statistics #7; Author: CrashCourse;https://www.youtube.com/watch?v=bPFNxD3Yg6U;License: Standard YouTube License, CC-BY
Shape, Center, and Spread - Module 20.2 (Part 1); Author: Mrmathblog;https://www.youtube.com/watch?v=COaid7O_Gag;License: Standard YouTube License, CC-BY
Shape, Center and Spread; Author: Emily Murdock;https://www.youtube.com/watch?v=_YyW0DSCzpM;License: Standard Youtube License