
Concept explainers
Videos
The bar graph at the top of the next column shown the differences among political identification groups on the Implicit Association Test that measures levels of racial prejudice. Higher scores indicate stronger bias.
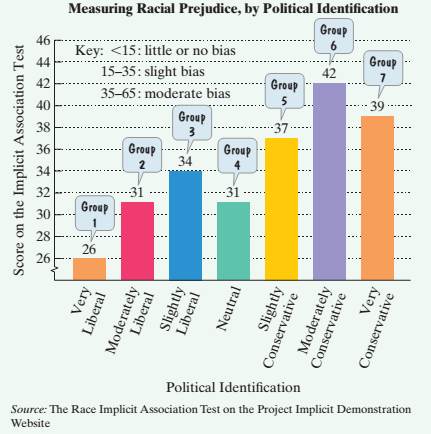
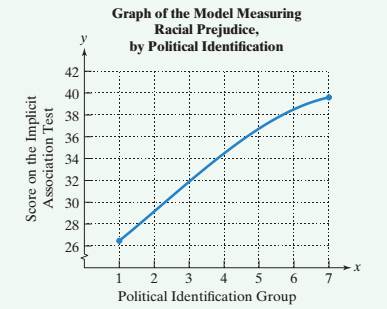
- The data can be described by the following polynomial model of degree 3:
In this polynomial model, S represents the score on the Implicit Association Test for political identification group x. Simplify the model.
b. Use the simplified from of the model from part (a) to find the score on the Implicit Association Test for the slightly conservative political identification group. Does the model underestimate or overestimate the score displayed by the bar graph? By how much?
c. Show in a rectangular
Want to see the full answer?
Check out a sample textbook solution
Chapter 5 Solutions
Introductory and Intermediate Algebra for College Students (5th Edition)


- Which rate best represents the relationship between the number of players and the number of fieldsarrow_forwardUse finite difference to determine the degree of the polynomial that best describes the dataarrow_forwardGiven n+1 data pairs, a unique polynomial of degree passes through n +1 data points. Select one: a. n+1 O b. n or less С. n d. n+1 or lessarrow_forward
- (b) Fit a second degree polynomial to the following data : Year : 1882 1883 1884 1885 1886 1887 1888 1889 1890 Price Index: 84 82 76 72 69 68 70 72 73arrow_forwardActivity 1 Direction: Determine whether each expression is a polynomial or NOT. 1. x2 + 2x + 1 = 0 6. 2 x2- 1 = 0 11. 2x2 + 3x + 1 0 2. 5x³ + = 0 7.% x* y3-21x = 0 12. x2 + Vx - 8 = 0 3. 5x 2+5 = 0 8. 9 + vx - 3 = 0 13. 4x³ = 0 4. 10x* 2x + 1 = 0 "9. vy + 2 = 0 14.- -3 = 0 5. -x2 + 10 = 0 10.4 x3 + 2x = 0 15. X20 - 1 = 0arrow_forwardEstimate the Malaysia carbon dioxide (CO2) emission per capita in year 2005 and 2016 by using third order Lagrange interpolating polynomial. Present the calculation on Excel and standardize all values in 4 decimal places. Malaysia Carbon Dioxide (CO2) Emission per Capita Year 2003 9.63 2006 8.75 2008 8.66 2009 7.37 2011 7.81 2014 7.99arrow_forward
- The fuel economy of a car (miles per gallon) varies with its speed. In an experiment, the following five measurements are obtained: Speed (mph) 10 25 40 55 70 Fuel economy (mpg) 12 26 28 30 24 Use quadratic splines interpolation with the data above, to calculate the fuel economy at a speed of (a) 30 mph and (b) 65 mph.arrow_forwardThe Brazilian Amazon rain forest is the world’s largest tropical rain forest, with some of the greatest biodiversity of any region. In 2012, the number of trees cut down in the Amazon dropped to its lowest level in 20 years. The line graph (see attached) shows the number of square kilometers cleared from 2001 through 2012. The data in the line graph can be modeled by the following third- and fourth-degree polynomial functions (see attached): Then Solve; a. Use the Leading Coefficient Test to determine the end behavior to the right for the graph of f. b. Assume that the rate at which the Amazon rain forest is being cut down continues to decline. Based on your answer to part (a), will f be useful in modeling Amazon deforestation over an extended period of time? Explain your answer. c. Use the Leading Coefficient Test to determine the end behavior to the right for the graph of g. d. Assume that the rate at which the Amazon rain forest is being cut down continues to decline. Based on your…arrow_forward
 Algebra & Trigonometry with Analytic GeometryAlgebraISBN:9781133382119Author:SwokowskiPublisher:Cengage
 Algebra: Structure And Method, Book 1AlgebraISBN:9780395977224Author:Richard G. Brown, Mary P. Dolciani, Robert H. Sorgenfrey, William L. ColePublisher:McDougal Littell