
Concept explainers
Videos
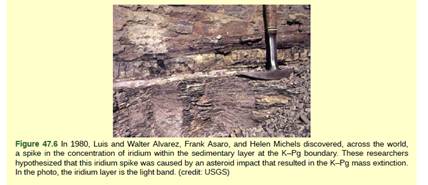
Figure 47.6 Scientists measured the relative abundance ot fern spores above and below the K-Pg boundary in this reck sample. Which of the following statements most likely represents their findings?
- An abundance of fern spores from several species was found below the K-Pg boundary, but none was found above.
Introduction:
The K-Pg extinction or K-T extinction called as Cretaceous Paleogene extinction eliminated 80% of all species of animals and plants about 66 million years ago. We can see at the boundary between the terrestrial and marine ecosystem, there were present high levels of iridium metal that was said to be from the asteroid that had hit earth. There was huge amount of organic matter that was obtained by the decay of destruction of plants leading to growth of fungi as these are saprophytic and thrived for many years.
Answer to Problem 1VCQ
Correct answer:
The correct answer is option (a) A lot of fern spores from several species was found below the K-Pg boundary, but none was found above.
Explanation of Solution
Explanation/justification for the correct answer:
Option (a) A lot of fern spores from several species was found below the K-Pg boundary, but none was found above. During that period, there was the destruction of plants that lead to a proliferation of fungi as these are saprophytic and thrive on dead matter. The general environment was dominated by photosynthetic organisms namely ferns that lead to an increase in fern throughout the geological area. The spores were found below the boundary as it dominated over the other angiosperm pollen grains.
Explanation for incorrect answers:
Option (b) A lot of fern spores from several species was found below the K-Pg boundary, but none was found below. With the destruction of plants, fungi developed in large numbers as these are saprophytic dominating the other angiosperms. The spores were found to below the boundary. Hence, this option is not correct.
Option (c) A lot of fern spores from several species was found both above and below the K-Pg boundary, but only one species was found below the boundary and many species were found above the boundary. With the destruction of plants, fungi developed in large numbers as these are saprophytic dominating the other angiosperms. The spores were found to below the boundary. Hence, this option is not correct.
Option (d) Many species of fern spores were found both above and below the boundary, but the total number of spores was greater below the boundary. With the destruction of plants, fungi developed in large numbers as the spore dispersal allowed to show dominance. Though the ferns faded, their spores were found below the boundary. There were many types of spores found and not only one. Hence, this option is not correct.
Scientists measured the relative abundance of fern spores above and below the K-Pg boundary in this rock sample. With the destruction of plants, fungi developed in large numbers as the spore dispersal allowed to show dominance. Though the ferns faded, their spores were found below the boundary.
Hence, the statement (a) is correct.
Want to see more full solutions like this?
Chapter 47 Solutions
Biology 2e
Additional Science Textbook Solutions
College Physics
Campbell Biology in Focus
Concepts of Genetics (11th Edition)
Microbiology: An Introduction
Anatomy & Physiology
Fundamentals of Anatomy & Physiology (11th Edition)


- Table 1. Average turgor loss point, stem hydraulic conductivity and plant water use efficiency for the two species. Trait Species A Species B Statistics Turgor loss point -2.5 MPa -1.1. MPa p <0.033 Hydraulic conductivity 0.11 Kg mm-1 MPa-1 s-1 0.33 Kg mm-1 MPa-1 s-1 p <0.005 Water use efficiency 80.6 µmol mol-1 47.1 µmol mol-1 p <0.004 Explain using data from Table 1 and Figure 2 the two different physiological strategies for these species against the environmental stressors expected from Figure 1. Figure 2.(attached) Pre-dawn and midday leaf water potential (Ψleaf) for the two species at different dates throughout the year.arrow_forwardCalculate Shannon Diversity Index (H) and Evenness(e) of order. (Hymneoptera(Bee), of autumn season in excel showing all calculations. Show all ca;culation of excel as well. The data is given below. Species Abundance(S) Apis Cerena 14 Apis mellifera 12 Total 28 You put the data wrong in the same question last time so I have totaled it for you. Please check it. You put 2 instead of 12 in abundance of Apis mellifera last time.arrow_forwardDraw a species accumulation curve for the beetles in Area C3, based on the data shown in Table 2. Ensure that you calculate a standard deviation around each average number of species per sample; plot this on this figure. Make sure you label the axes and that you provide a legend. You will need to reassemble the samples in all possible combinations in order to derive the species area curve(Table provided)arrow_forward
- Table 1. Average turgor loss point, stem hydraulic conductivity and plant water use efficiency for the two species. Trait Species A Species B Statistics Turgor loss point -2.5 MPa -1.1. MPa p <0.033 Hydraulic conductivity 0.11 Kg mm-1 MPa-1 s-1 0.33 Kg mm-1 MPa-1 s-1 p <0.005 Water use efficiency 80.6 µmol mol-1 47.1 µmol mol-1 p <0.004 Please Describe the data in Table 1arrow_forwardWhat are the limitations or constraints that can lead to sampling bias when creating a study about seagrass density in an area?arrow_forwardDraw a species accumulation curve for the beetles in Area C3, based on the data shown in Table 2. Ensure that you calculate a standard deviation around each average number of species per sample; plot this on this figure. Make sure you label the axes and that you provide a legend. You will need to reassemble the samples in all possible combinations in order to derive the species area curve.(porvided the table)arrow_forward
- Answer each question in 300 words: 1. What is ecological sampling? 2. What size and shape of quadrat would you use to measure (a) the density of seagrasses and (b) the density of mangroves in Taklong Island National Marine Reserve, Guimaras? Support your answer in (a) and (b)arrow_forwardWe measure species density in plant ecosystems, When random sampling and systematic sampling approach the actual density?Why did your method make sense to you?arrow_forwardAlnus Salix Picea 100 80 Time since glaciation (years) 17 40 60 120 138 The graph shows data of plant species richness as a function of time measured in plots that were dominated by either Alnus (black, solid lines), Salix (yellow, dotted line) or Picea (blue, dashed line) (Buma et al. 2019). (FYI: Alnus is alder, Salix is willow, Picea is spruce) Each line describes the average change of plant species richness through time in those plots. For each of the dominant species in those plots, determine whether they facilitate, inhibit or have no effect on species richness in late successional stages. Alnus [ Select ] Salix [ Select ] Picea [ Select ] Plant species richness in plotsarrow_forward
- The study explored population diversity of fungal endophytes present in the mangrove Sonneratia alba (Pagatpat). These endophytes were isolated, characterized morphologically and molecularly identified by amplification of the ITS gene. Phylogenetic analysis using maximum likelihood was performed on the sequences to elucidate the identification of various isolates. 11 species were isolated from both Tacloban and Matalom sites, but four (4) of these species were unique to Matalom. Based on the computed Shannon-Weiner indices, host mangroves from Matalom (H’=2.738) were more diverse compared to the host mangroves from Tacloban (H’=2.505). Gleason’s Species Richness indices also showed that leaves collected from Matalom (d=4.277) exhibited a greater species richness than leaves from Tacloban (d=3.256). The results implied that alba generally possess the same species of fungal endophytes; but diversity and species are affected by the environmental conditions, geographical location and the…arrow_forwardErnie's school has three greenhouses, located in three parts of the school. Ernie notices that the plants in one greenhouses are smaller than the same species in the other greenhouses. Ernie's biology teacher says she has been having a problem recently with growing plants in this particular greenhouse. Ernie's lab group decides to investigate factors such as light levels, temperature, and soil nutrients in the three greenhouses. They find that these are the same for all the rooms. What additional factors would you suggest testing for, and how would each of these factors affect the growth of plants? 20arrow_forwardAn ecologist studying plants in the desert performed the following experiment. She staked out two identical plots, which included a few sagebrush plants and numerous small, annual wildflowers. She found the same five wildflower species in roughly equal numbers on both plots. She then enclosed one of the plots with a fence to keep out kangaroo rats, the most common grain-eaters of the area. After two years, to her surprise, four of the wildflower species were no longer present in the fenced plot, but one species had increased dramatically. The control plot had not changed. Using the principles of ecology, propose a hypothesis to explain her results. What additional evidence would support your hypothesis?arrow_forward
- Biology 2eBiologyISBN:9781947172517Author:Matthew Douglas, Jung Choi, Mary Ann ClarkPublisher:OpenStax
 Biology (MindTap Course List)BiologyISBN:9781337392938Author:Eldra Solomon, Charles Martin, Diana W. Martin, Linda R. BergPublisher:Cengage Learning