
Concept explainers
Videos
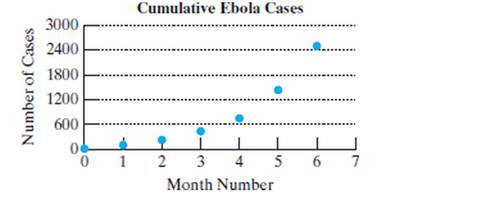
During a recent outbreak of Ebola in western Africa, the cumulative number of cases y was reported! months after April 1. (See Example 7)
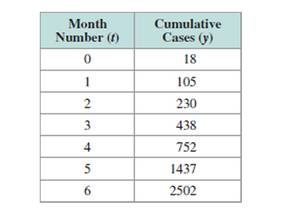
a. Use a graphing utility to find a model of the form
b. Write the function from part (a) as an exponential function of the form
c. Use either model to predict the number of Ebola cases 8 months after April 1 if this trend continues. Round to the nearest thousand.
d. Would it seem reasonable for this trend to continue indefinitely?
e. Use a graphing utility to find a logistic model
f. Use the logistic model from part (e) to predict the number of Ebola cases 8 months after April 1. Round to the nearest thousand.
Want to see the full answer?
Check out a sample textbook solution
Chapter 4 Solutions
College Algebra & Trigonometry - Standalone book


- Enter the data from Table 2 into a graphing calculator and graph the ranking scatter plot. Determine whetherthe data from the table would likely represent a function that is linear, exponential, or logarithmic.arrow_forwardDoes a linear, exponential, or logarithmic model best fit the data in Table 2? Find the model.arrow_forwardWhat might a scatterplot of data points look like if it were best described by a logarithmic model?arrow_forward

 Glencoe Algebra 1, Student Edition, 9780079039897...AlgebraISBN:9780079039897Author:CarterPublisher:McGraw Hill
 Algebra & Trigonometry with Analytic GeometryAlgebraISBN:9781133382119Author:SwokowskiPublisher:Cengage
 Trigonometry (MindTap Course List)TrigonometryISBN:9781337278461Author:Ron LarsonPublisher:Cengage Learning