
Concept explainers
Videos
LINKING concepts... For Individual or Group Explorations
The Logistic Growth Model
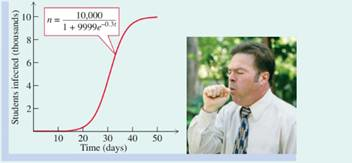
When a virus infects a finite population of size P in which no one is immune, the virus spreads slowly at first, then rapidly like exponential growth. Since the population is finite, the exponential growth must slow down as nearly everyone becomes infected. This type of behavior was named the logistic function or logistic curve in 1844 by Pierre Franҫ? ois Verhulst. The logistic function has the form
a) According to the model, how many people have caught the virus at time t = 0?
b) Now consider what happens when one student carrying a flu virus returns from spring break to a university of 10,000 students. For c = 0.1,0.2, and so on through c = 0.9, graph the logistic curve
y1 = 10000/ (1 + 9999e^(–cx))
and the daily number of new cases
y2= y1(x) – y1(x – 1)
For each value of c use the graph of y2 to find the day on which the flu is spreading most rapidly.
c) The Health Center estimated that the greatest number of new cases of the flu occurred on the 19th day after the students returned from spring break. What value of c should be used to model this situation? How many new cases occurred on the 19th day?
d) Algebraically find the day on which the number of infected students reached 9000.
e) The Health Center has a team of doctors from Atlanta arriving on the 30th day to help with this three-day flu epidemic. What do you think of this plan?
Want to see the full answer?
Check out a sample textbook solution
Chapter 4 Solutions
College Algebra (6th Edition)


- Sales of a video game released in the year 2000 took off at first, but then steadily slowed as time moved on. Table 4 shows the number of games sold, in thousands, from the years 20002010. a. Let x represent time in years starting with x=1 for the year 2000. Let y represent the number of games sold in thousands. Use logarithmic regression to fit a model to these data. b. If games continue to sell at this rate, how many games will sell in 2015? Round to the nearest thousand.arrow_forwardWhat does the y -intercept on the graph of a logistic equation correspond to for a population modeled by that equation?arrow_forwardWhat situations are best modeled by a logistic equation? Give an example, and state a case for why the example is a good fit.arrow_forward
 Calculus For The Life SciencesCalculusISBN:9780321964038Author:GREENWELL, Raymond N., RITCHEY, Nathan P., Lial, Margaret L.Publisher:Pearson Addison Wesley,
 Functions and Change: A Modeling Approach to Coll...AlgebraISBN:9781337111348Author:Bruce Crauder, Benny Evans, Alan NoellPublisher:Cengage Learning
 Algebra & Trigonometry with Analytic GeometryAlgebraISBN:9781133382119Author:SwokowskiPublisher:Cengage
 College Algebra (MindTap Course List)AlgebraISBN:9781305652231Author:R. David Gustafson, Jeff HughesPublisher:Cengage Learning
 College AlgebraAlgebraISBN:9781305115545Author:James Stewart, Lothar Redlin, Saleem WatsonPublisher:Cengage Learning