
Mathematics All Around (6th Edition)
6th Edition
ISBN: 9780134434681
Author: Tom Pirnot
Publisher: PEARSON
expand_more
expand_more
format_list_bulleted
Concept explainers
Videos
Textbook Question
Chapter 4.4, Problem 4E
Sharpening Your Skills.
In Exercises 1 – 4, assume that the time is measured in days.
Use the following PERT diagram to answer the following questions:
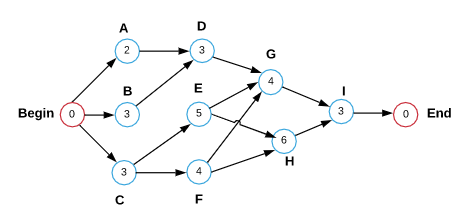
| a. Find a critical path for task G. |
| b. Find a critical path for task H. |
| c. What is a critical path for “End”? |
| d. When should task H be scheduled? |
| e. When should we schedule task G? |
| f. How many days are required for the whole project? |
Expert Solution & Answer
Want to see the full answer?
Check out a sample textbook solution
Students have asked these similar questions
In 2010, MonsterCollege surveyed 1250 U.S.college students expecting to graduate in the next several years.Respondents were asked the following question:What do you think your starting salary will be at your firstjob after college?The line graph shows the percentage of college students whoanticipated various starting salaries. Use the graph to solveExercises 9–14.
What starting salary was anticipated by the greatestpercentage of college students? Estimate the percentage ofstudents who anticipated this salary?
What starting salary was anticipated by the least percentageof college students? Estimate the percentage of students whoanticipated this salary?
What starting salaries were anticipated by more than 20% ofcollege students?
Estimate the percentage of students who anticipated astarting salary of $40 thousand.
Q. Table provided gives data on gross domestic product (GDP) for the United States for the years 1959–2005.
a. Plot the GDP data in current and constant (i.e., 2000) dollars against time.
b. Letting Y denote GDP and X time (measured chronologically starting with 1 for 1959, 2 for 1960, through 47 for 2005), see if the following model fits the GDP data:
Yt = β1 + β2 Xt + ut
Estimate this model for both current and constant-dollar GDP.
c. How would you interpret β2?
d. If there is a difference between β2 estimated for current-dollar GDP and that estimated for constant-dollar GDP, what explains the difference?
e. From your results what can you say about the nature of inflation in the United States over the sample period?
In Exercises 1–6, solve for x.
Chapter 4 Solutions
Mathematics All Around (6th Edition)
Ch. 4.1 - In Exercise 1-6, determine whether the graph is...Ch. 4.1 - In Exercise 1-6, determine whether the graph is...Ch. 4.1 - In Exercise 1-6, determine whether the graph is...Ch. 4.1 - In Exercise 1-6, determine whether the graph is...Ch. 4.1 - In Exercise 1-6, determine whether the graph is...Ch. 4.1 - In Exercise 1-6, determine whether the graph is...Ch. 4.1 - In Exercises 7-12, use Eulers theorem to decide...Ch. 4.1 - In Exercises 7-12, use Eulers theorem to decide...Ch. 4.1 - In Exercises 7-12, use Eulers theorem to decide...Ch. 4.1 - In Exercises 7-12, use Eulers theorem to decide...
Ch. 4.1 - In Exercises 7-12, use Eulers theorem to decide...Ch. 4.1 - In Exercises 7-12, use Eulers theorem to decide...Ch. 4.1 - In Exercise 13-16, if the given graph is Eulerian,...Ch. 4.1 - In Exercise 13-16, if the given graph is Eulerian,...Ch. 4.1 - In Exercise 13-16, if the given graph is Eulerian,...Ch. 4.1 - In Exercise 13-16, if the given graph is Eulerian,...Ch. 4.1 - In Exercises 17-24, try to give an example of each...Ch. 4.1 - Prob. 18ECh. 4.1 - In Exercises 17-24, try to give an example of each...Ch. 4.1 - In Exercises 17-24, try to give an example of each...Ch. 4.1 - In Exercises 17-24, try to give an example of each...Ch. 4.1 - Prob. 22ECh. 4.1 - Prob. 23ECh. 4.1 - Prob. 24ECh. 4.1 - In Exercise 25-28, remove one edge to make the...Ch. 4.1 - Prob. 26ECh. 4.1 - Prob. 27ECh. 4.1 - In Exercise 25-28, remove one edge to make the...Ch. 4.1 - In Exercise 29-32, try to redraw the given graph...Ch. 4.1 - In Exercise 29-32, try to redraw the given graph...Ch. 4.1 - In Exercise 29-32, try to redraw the given graph...Ch. 4.1 - In Exercise 29-32, try to redraw the given graph...Ch. 4.1 - Finding an efficient route. A taxi driver wants to...Ch. 4.1 - Finding an efficient route. Repeat Exercises 33...Ch. 4.1 - Exercise 35 and 36 are similar to DUCK tour...Ch. 4.1 - Exercise 35 and 36 are similar to DUCK tour...Ch. 4.1 - Represent the maps given in Exercises 37-40 by...Ch. 4.1 - Represent the maps given in Exercises 37-40 by...Ch. 4.1 - Represent the maps given in Exercises 37-40 by...Ch. 4.1 - Represent the maps given in Exercises 37-40 by...Ch. 4.1 - Prob. 41ECh. 4.1 - Prob. 42ECh. 4.1 - Prob. 43ECh. 4.1 - Prob. 44ECh. 4.1 - Prob. 45ECh. 4.1 - Prob. 46ECh. 4.1 - Prob. 47ECh. 4.1 - In Exercises 4548, we give you a group of states....Ch. 4.1 - Finding an efficient route. Because of Michaels...Ch. 4.1 - Prob. 50ECh. 4.1 - Use the technique that we used in Example 7 to do...Ch. 4.1 - Use the technique that we used in Example 7 to do...Ch. 4.1 - Use the technique that we used in Example 7 to do...Ch. 4.1 - Use the technique that we used in Example 7 to do...Ch. 4.1 - If, in tracing a graph, we neither begin nor end...Ch. 4.1 - Examine a number of the graphs that we have drawn...Ch. 4.1 - Can an Eulerian graph have a bridge? In order to...Ch. 4.1 - Consider any graph that has some odd and also some...Ch. 4.1 - Discuss specific examples of ways that...Ch. 4.1 - Prob. 60ECh. 4.1 - Draw a graph that can be colored with only two...Ch. 4.1 - Draw a graph that cannot be colored with two...Ch. 4.1 - Draw a graph that cannot be colored with three...Ch. 4.1 - Can you state what configuration of vertices will...Ch. 4.1 - Different notes on a trumpet are obtained by...Ch. 4.1 - If an instrument has four valves, there are 16...Ch. 4.1 - Assume that the registrar at your school is...Ch. 4.1 - Make up a scheduling problem that would be of some...Ch. 4.2 - Prob. 1ECh. 4.2 - Prob. 2ECh. 4.2 - Prob. 3ECh. 4.2 - Prob. 4ECh. 4.2 - Prob. 5ECh. 4.2 - Prob. 6ECh. 4.2 - Prob. 7ECh. 4.2 - Prob. 8ECh. 4.2 - How many Hamilton circuits are in K7?Ch. 4.2 - How many Hamilton circuits are in K8?Ch. 4.2 - Prob. 11ECh. 4.2 - Prob. 12ECh. 4.2 - Prob. 13ECh. 4.2 - Prob. 14ECh. 4.2 - Prob. 15ECh. 4.2 - Prob. 16ECh. 4.2 - Prob. 17ECh. 4.2 - Prob. 18ECh. 4.2 - Prob. 19ECh. 4.2 - Prob. 20ECh. 4.2 - Prob. 21ECh. 4.2 - Prob. 22ECh. 4.2 - Prob. 23ECh. 4.2 - Prob. 24ECh. 4.2 - In Exercises 23 -28, use the best edge algorithm...Ch. 4.2 - Prob. 26ECh. 4.2 - In Exercise 23 -28, use the best edge algorithm to...Ch. 4.2 - In Exercise 23 -28, use the best edge algorithm to...Ch. 4.2 - Simon Cowell plans a series of live shows from...Ch. 4.2 - ESPN is planning to do a special series called...Ch. 4.2 - Foodandwine.com states that the best ice cream...Ch. 4.2 - In order to try to solve a European financial...Ch. 4.2 - Prob. 33ECh. 4.2 - Prob. 34ECh. 4.2 - Prob. 35ECh. 4.2 - Prob. 36ECh. 4.2 - Prob. 37ECh. 4.2 - Prob. 38ECh. 4.2 - Prob. 39ECh. 4.2 - Prob. 40ECh. 4.2 - Prob. 41ECh. 4.2 - Prob. 42ECh. 4.2 - Prob. 43ECh. 4.2 - Prob. 44.1ECh. 4.2 - Prob. 44.2ECh. 4.2 - Prob. 45.1ECh. 4.2 - Prob. 45.2ECh. 4.2 - Prob. 45.3ECh. 4.2 - Prob. 49ECh. 4.2 - Prob. 51ECh. 4.2 - Prob. 52ECh. 4.3 - In Exercises 1-4, use each graph to find the...Ch. 4.3 - In Exercises 1-4, use each graph to find the...Ch. 4.3 - In Exercises 1-4, use each graph to find the...Ch. 4.3 - In Exercises 1-4, use each graph to find the...Ch. 4.3 - Prob. 5ECh. 4.3 - Prob. 6ECh. 4.3 - Prob. 7ECh. 4.3 - Prob. 8ECh. 4.3 - Modeling the spread of rumours. Ryan, Dwight, Pam,...Ch. 4.3 - Modeling the spread of classified information....Ch. 4.3 - Modeling the flow of paperwork through a...Ch. 4.3 - Modeling the spread of disease. The following...Ch. 4.3 - Prob. 13ECh. 4.3 - Modeling a communication network. An AMBER alert...Ch. 4.3 - Ranking football teams. The given graph shows the...Ch. 4.3 - Ranking American Gladiators. The graph below shows...Ch. 4.3 - Modeling influence. A designer who wishes to...Ch. 4.3 - Prob. 18ECh. 4.3 - Prob. 19ECh. 4.3 - Ranking CrossFit competitors. CrossFit is a...Ch. 4.3 - Prob. 21ECh. 4.3 - Prob. 22ECh. 4.3 - Prob. 23ECh. 4.3 - Prob. 24ECh. 4.3 - Prob. 25ECh. 4.3 - Prob. 26ECh. 4.3 - Prob. 27ECh. 4.3 - Prob. 28ECh. 4.3 - Prob. 29ECh. 4.3 - Communicating Mathematics In the incidence...Ch. 4.3 - Math in Your Life: Between the Numbers The history...Ch. 4.3 - Prob. 32ECh. 4.3 - Prob. 33ECh. 4.3 - Prob. 34ECh. 4.4 - Sharpening Your Skills. In Exercises 1 4, assume...Ch. 4.4 - Sharpening Your Skills. In Exercises 1 4, assume...Ch. 4.4 - Sharpening Your Skills. In Exercises 1 4, assume...Ch. 4.4 - Sharpening Your Skills. In Exercises 1 4, assume...Ch. 4.4 - Sharpening Your Skills. In Exercises 5 8, use the...Ch. 4.4 - Sharpening Your Skills. In Exercises 5 8, use the...Ch. 4.4 - Sharpening Your Skills. In Exercises 5 8, use the...Ch. 4.4 - Sharpening Your Skills. In Exercises 5 8, use the...Ch. 4.4 - Applying What Youve Learned. Planning a festival....Ch. 4.4 - Applying What Youve Learned. Organizing a project....Ch. 4.4 - Applying What Youve Learned. Building a student...Ch. 4.4 - Applying What Youve Learned. Organizing a health...Ch. 4.4 - Applying What Youve Learned. Organizing an...Ch. 4.4 - Communicating Mathematics. Study Figure 4.35 with...Ch. 4.4 - Communicating Mathematics. Write a brief report on...Ch. 4.4 - Challenge yourself. Planning an innovative house....Ch. 4.CR - Section 4.1 Use the preceding graph to answer the...Ch. 4.CR - Section 4.1 Explain how graphs are used to model a...Ch. 4.CR - Section 4.1 Which of the following graphs can be...Ch. 4.CR - Section 4.1 Use Fleurys algorithm to find an Euler...Ch. 4.CR - Section 4.1 Model the following street map with a...Ch. 4.CR - Prob. 6CRCh. 4.CR - Section 4.1 Allison, Branden, Colin, Donny, Erica,...Ch. 4.CR - Section 4.2 Find all Hamilton circuits that begin...Ch. 4.CR - Section 4.2 Use the following weighted graph to...Ch. 4.CR - Section 4.2 Use the following weighted graph to...Ch. 4.CR - Prob. 11CRCh. 4.CR - Prob. 12CRCh. 4.CR - Section 4.3 When are directed graphs rather than...Ch. 4.CR - Section 4.3 A student action committee has been...Ch. 4.CR - Section 4.4 Use the following PERT diagram to...Ch. 4.CR - Section 4.4 Congratulations You are planning your...Ch. 4.CT - Use the preceding graph to answer the following...Ch. 4.CT - Which of the following graphs can be traced? If a...Ch. 4.CT - Use Fleurys algorithm to find an Euler circuit in...Ch. 4.CT - Find all Hamilton circuits that begin at vertex A...Ch. 4.CT - Model the following street map with a graph and...Ch. 4.CT - Prob. 6CTCh. 4.CT - Use the following weighted graph to answer...Ch. 4.CT - Use the following weighted graph to answer...Ch. 4.CT - Use the following weighted graph to answer...Ch. 4.CT - Use the given directed graph to find the following...Ch. 4.CT - Use the given PERT diagram to answer the following...Ch. 4.CT - The following graph models one- and two-stage...
Knowledge Booster


Learn more about
Need a deep-dive on the concept behind this application? Look no further. Learn more about this topic, subject and related others by exploring similar questions and additional content below.Similar questions
- For Exercises 33–38, find the exact value of each expression without the use of a calculator. (See Example 5)arrow_forward21–23. Language enrollments. The line graph in Figure 2.28 shows total course enrollments in languages other than English in U.S. institutions of higher education from 1960 to 2009. (Enrollments in ancient Greek and Latin are not included.) Exercises 21 through 23 refer to this figure. 1,800,000 1,629,326 1.522.770 1,600,000 - 1,400,000 - 1347.036 1,200,000- 1,073,097 1,067,217 1,000.000 - 975.7m 963,930 883.222 1.06.603 922,439 960.588 B00,000 - 97.077 877.91 600,000 - 608,749 400.000 - 200,000 - 1960 1965 1968 | 1972 1977 1980 1983 1986 1990 1995 199 2002 2006 2009 1970 1974 Figure 2.28 Crauder, et al., Quantitative Literacy, 3e, © 2019 W. H. Freeman and Company FIGURE 2.28 Enrollments in languages other than English in U.S. institutions of higher education (2009). 21. During which time periods did the enrollments decrease? 22. Calculate the average growth rate per year in enrollments over the two periods 1960–1965 and 2006– 2009. Note that the time periods are not of the same…arrow_forwardInsurance Rates The following table gives themonthly insurance rates for a $100,000 life insurancepolicy for smokers 35–50 years of age.a. Create a scatter plot for the data.b. Does it appear that a quadratic function can beused to model the data? If so, find the best-fittingquadratic model.c. Find the power model that is the best fit for the data.d. Compare the two models by graphing each modelon the same axes with the data points. Whichmodel appears to be the better fit?arrow_forward
- Exercises 93–94: Energy The following graph shows U.S. Energy consumption. 400 350 300 250 200 150 100 50 04 1970 1990 2010 Year 93. When was energy consumption increasing? 94. When was energy consumption decreasing? Energy (millions of Btu)arrow_forwardWorld Military Expenditure The following chart shows total military and arms trade expenditure from 2011–2020 (t = 1 represents 2011). †A bar graph titled "World military expenditure" has a horizontal t-axis labeled "Year since 2010" and a vertical axis labeled "$ (billions)". The bar graph has 10 bars. Each bar is associated with a label and an approximate value as listed below. 1: 1,800 billion dollars 2: 1,775 billion dollars 3: 1,750 billion dollars 4: 1,730 billion dollars 5: 1,760 billion dollars 6: 1,760 billion dollars 7: 1,850 billion dollars 8: 1,900 billion dollars 9: 1,950 billion dollars 10: 1,980 billion dollars (a) If you want to model the expenditure figures with a function of the form f(t) = at2 + bt + c, would you expect the coefficient a to be positive or negative? Why? HINT [See "Features of a Parabola" in this section.] We would expect the coefficient to be positive because the curve is concave up. We would expect the coefficient to be negative because the…arrow_forwardThe Internal Revenue Service Restructuring and Reform Act (RRA) was signed into law by President Bill Clinton in 1998. A major objective of the RRA was to promote electronic filing of tax returns. The data in the table that follows show the percentage of individual income tax returns filed electronically for filing years 2000–2008. Since the percentage P of returns filed electronically depends on the filing year y and each input corresponds to exactly one output, the percentage of returns filed electronically is a function of the filing year;so P(y) represents the percentage of returns filed electronically for filing year y. (a) Find the average rate of change of the percentage of e-filed returns from 2000 to 2002. (b) Find the average rate of change of the percentage of e-filed returns from 2004 to 2006. (c) Find the average rate of change of the percentage of e-filed returns from 2006 to 2008. (d) What is happening to the average rate of change as time passes?arrow_forward
- Q1. The table provided gives data on indexes of output per hour (X) and real compensation per hour (Y) for the business and nonfarm business sectors of the U.S. economy for 1960–2005. The base year of the indexes is 1992 = 100 and the indexes are seasonally adjusted. a. Plot Y against X for the two sectors separately. b. What is the economic theory behind the relationship between the two variables? Does the scattergram support the theory? c. Estimate the OLS regression of Y on X. Note: on the table ( 1. Output refers to real gross domestic product in the sector. 2. Wages and salaries of employees plus employers’ contributions for social insurance and private benefit plans. 3. Hourly compensation divided by the consumer price index for all urban consumers for recent quarters.) Thank you!arrow_forwardIn Exercises 61–64, find an equation for the level surface of the function through the given point.arrow_forwardThe figure shows the graphs of the cost and revenue functions for a company that manufactures and sells small radios. Use the information in the figure to solve Exercises 67–72. 35,000 30,000 C(x) = 10,000 + 30x 25,000 20,000 15,000 R(x) = 50x 10,000 5000 100 200 300 400 500 600 700 Radios Produced and Sold 67. How many radios must be produced and sold for the company to break even? 68. More than how many radios must be produced and sold for the company to have a profit? 69. Use the formulas shown in the voice balloons to find R(200) – C(200). Describe what this means for the company. 70. Use the formulas shown in the voice balloons to find R(300) – C(300). Describe what this means for the company. 71. a. Use the formulas shown in the voice balloons to write the company's profit function, P, from producing and selling x radios. b. Find the company's profit if 10,000 radios are produced and sold. 72. a. Use the formulas shown in the voice balloons to write the company's profit function,…arrow_forward
arrow_back_ios
SEE MORE QUESTIONS
arrow_forward_ios
Recommended textbooks for you
 Algebra & Trigonometry with Analytic GeometryAlgebraISBN:9781133382119Author:SwokowskiPublisher:Cengage
Algebra & Trigonometry with Analytic Geometry
Algebra
ISBN:9781133382119
Author:Swokowski
Publisher:Cengage
Use of ALGEBRA in REAL LIFE; Author: Fast and Easy Maths !;https://www.youtube.com/watch?v=9_PbWFpvkDc;License: Standard YouTube License, CC-BY
Compound Interest Formula Explained, Investment, Monthly & Continuously, Word Problems, Algebra; Author: The Organic Chemistry Tutor;https://www.youtube.com/watch?v=P182Abv3fOk;License: Standard YouTube License, CC-BY
Applications of Algebra (Digit, Age, Work, Clock, Mixture and Rate Problems); Author: EngineerProf PH;https://www.youtube.com/watch?v=Y8aJ_wYCS2g;License: Standard YouTube License, CC-BY