
Concept explainers
Videos
To give an example of real-life data set that shows
Answer to Problem 17E
The below table represents the birth rate as a function of the number of years since
Explanation of Solution
Given:
Example of Negative
Formula Used:
Correlation is Negative when one value decreases as the other increases.
Calculation:
Given:
Example of Negative correlation To find the example of real-life data set that shows negative correlation, let’s consider −
The birth rates
Plotting the above points on a graph, we have:
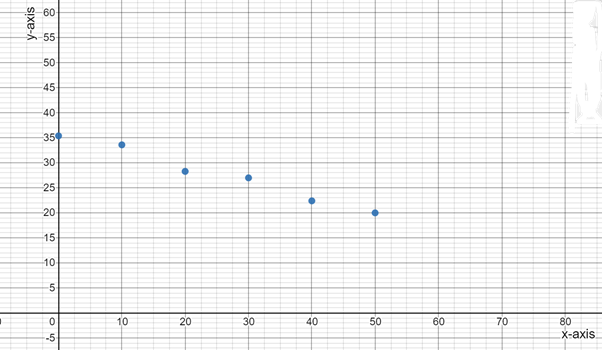
The above points represent a negative correlation.
Thus, the tablerepresents the birth rate as a function of the number of years since
Conclusion:
Thebelow table represents the birth rate as a function of the number of years since
Chapter 4 Solutions
BIG IDEAS MATH Integrated Math 1: Student Edition 2016


 Discrete Mathematics and Its Applications ( 8th I...MathISBN:9781259676512Author:Kenneth H RosenPublisher:McGraw-Hill Education
 Mathematics for Elementary Teachers with Activiti...MathISBN:9780134392790Author:Beckmann, SybillaPublisher:PEARSON
 Thinking Mathematically (7th Edition)MathISBN:9780134683713Author:Robert F. BlitzerPublisher:PEARSON
 Discrete Mathematics With ApplicationsMathISBN:9781337694193Author:EPP, Susanna S.Publisher:Cengage Learning,
 Pathways To Math Literacy (looseleaf)MathISBN:9781259985607Author:David Sobecki Professor, Brian A. MercerPublisher:McGraw-Hill Education