
Concept explainers
Videos
Use a calculator with an
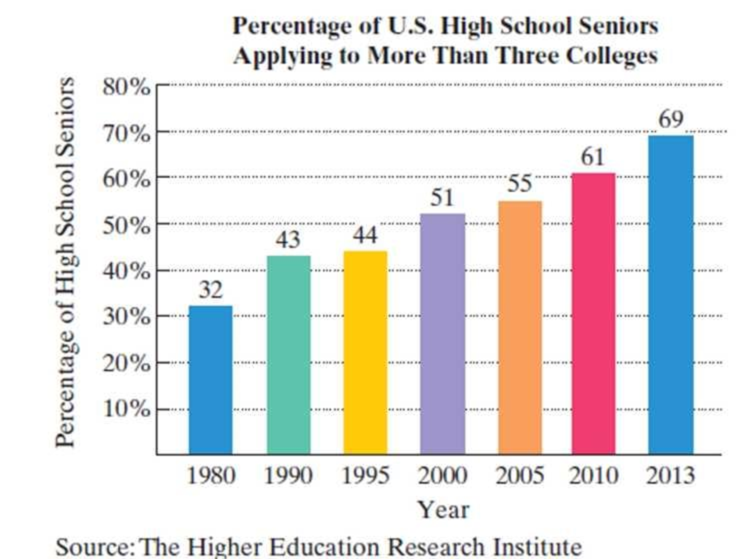
The bar graph shows the percentage of U.S. high school seniors who applied to more than three colleges for selected years from 1980 through 2013.
73. In college, we study large volumes of information—information that, unfortunately, we do not often retain for very long. The function
describes the percentage of information, f(x), that a particular person remembers x weeks after learning the information.
a. Substitute 0 for x and, without using a calculator, find the percentage of information remembered at the moment it is first learned.
b. Substitute 1 for x and find the percentage of information that is remembered after 1 week.
c. Find the percentage of information that is remembered after 4 weeks.
d. Find the percentage of information that is remembered after one year (52 weeks).
Want to see the full answer?
Check out a sample textbook solution
Chapter 4 Solutions
College Algebra Essentials (5th Edition)


- Your cardiac index is your heart's output, in liters of blood per minute, divided by your body's surface area, in square meters. The cardiac index, C(x), can be modeled by 7.644 C(x) = 10 s xs 80, where x is an individual's age, in years. The graph of the function is shown. Use the function to solve Exercises 95–96. 7.644 C(x) = %3D 10 20 30 40 50 60 70 80 90 Age 95. a. Find the cardiac index of a 32-year-old. Express the denominator in simplified radical form and reduce the fraction. b. Use the form of the answer in part (a) and a calculator to express the cardiac index to the nearest hundredth. Identify your solution as a point on the graph. 96. a. Find the cardiac index of an 80-year-old. Express the denominator in simplified radical form and reduce the fraction. Cardiac Index liters per minute squar e met ers 654 32arrow_forwardAmerica is getting older. The graph shows the projected elderly U.S. population for ages 65–84 and for ages 85 and older.The formula E = 5.8√x + 56.4 models the projected number of elderly Americans ages 65–84, E, in millions, x years after 2020.a. Use the formula to find the projected increase in the number of Americans ages 65–84, in millions, from 2030 to 2060. Express this difference in simplified radicalform.b. Use a calculator and write your answer in part (a) to the nearest tenth. Does this rounded decimal overestimate or underestimate the difference in the projected data shown by the bar graph ? By how much?arrow_forwardIn Exercises 41–48, write a piecewise formula for the function.arrow_forward
- Use this information to solve Exercises 9–11:A company is planning to produce and sell a new line of computers. The fixed cost will be $360,000 and it will cost $850 to produce each computer. Each computer will be sold for $1150. 9. Write the cost function, C, of producing x computers. 10. Write the revenue function, R, from the sale of x computers. 11. Determine the break-even point. Describe what this means.arrow_forwardThe average amount A (in pounds per person) of fish and shellfish consumed in the UnitedStates during the period 1992–2001 can be modeled by A = (3.2x + 260)/(52x + 3800) where x is the number of years since 1992.Rewrite the model so that it has only whole number coefficients. Then simplify the model.arrow_forwardExercises 93–94: Energy The following graph shows U.S. Energy consumption. 400 350 300 250 200 150 100 50 04 1970 1990 2010 Year 93. When was energy consumption increasing? 94. When was energy consumption decreasing? Energy (millions of Btu)arrow_forward
- Section 2.4: Chain Rule In Exercises 9–34, find the derivative of the function.arrow_forwardWorld Military Expenditure The following chart shows total military and arms trade expenditure from 2011–2020 (t = 1 represents 2011). †A bar graph titled "World military expenditure" has a horizontal t-axis labeled "Year since 2010" and a vertical axis labeled "$ (billions)". The bar graph has 10 bars. Each bar is associated with a label and an approximate value as listed below. 1: 1,800 billion dollars 2: 1,775 billion dollars 3: 1,750 billion dollars 4: 1,730 billion dollars 5: 1,760 billion dollars 6: 1,760 billion dollars 7: 1,850 billion dollars 8: 1,900 billion dollars 9: 1,950 billion dollars 10: 1,980 billion dollars (a) If you want to model the expenditure figures with a function of the form f(t) = at2 + bt + c, would you expect the coefficient a to be positive or negative? Why? HINT [See "Features of a Parabola" in this section.] We would expect the coefficient to be positive because the curve is concave up. We would expect the coefficient to be negative because the…arrow_forwardFor Exercises 49–52, rewrite the equation so that the coefficient on x is positive.arrow_forward
- In Exercises 61–64, find an equation for the level surface of the function through the given point.arrow_forwardIn Exercises 65–68, find and sketch the domain of ƒ. Then find an equation for the level curve or surface of the function passing through the given point.arrow_forwardFor Exercises 111–114, use the relationship given in the right triangle and the inverse sine, cosine, and tangent functions to write θ as a function of x in three different ways. It is not necessary to rationalize the denominator.arrow_forward
 Algebra & Trigonometry with Analytic GeometryAlgebraISBN:9781133382119Author:SwokowskiPublisher:Cengage