
Concept explainers
Videos
PROBLEMS
Tire inflation and Treadwear Car tires need to be inflated properly. Overinflation or underinflation can cause premature treadwear. The data in the margin show tire life for different inflation values for a certain type of tire.
(a) Find the quadratic polynomial that best fits the data.
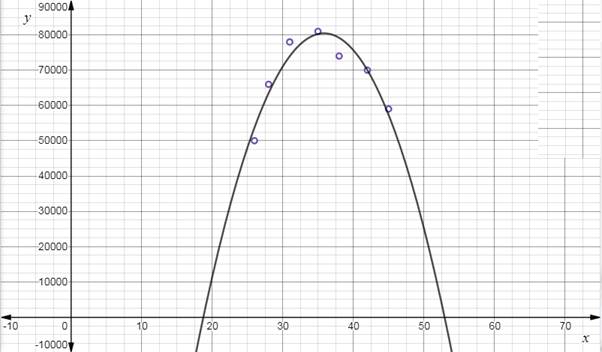
(b) Draw a graph of the polynomial from part(a) together with a
(c) Use your result from part(b) to estimate the pressure that gives the longest tire life.
| Pressure (lb/in2) | Tire life (mi) |
| 26 | 50,000 |
| 28 | 66,000 |
| 31 | 78,000 |
| 35 | 81,000 |
| 38 | 74,000 |
| 42 | 70,000 |
| 45 | 59,000 |
a)
To Find:
The quadratic polynomial that fits the data.
| Pressure (lb/in2) | Tire life (mi) |
| 26 | 50,000 |
| 28 | 66,000 |
| 31 | 78,000 |
| 35 | 81,000 |
| 38 | 74,000 |
| 42 | 70,000 |
| 45 | 59,000 |
Answer to Problem 1P
Solution:
The required quadratic polynomial is
Explanation of Solution
Given car tires need to be inflated properly. Overinflation or underinflation can cause premature treadwear. The data in the margin show tire life for different inflation values for a certain type of tire.
| Pressure (lb/in2) | Tire life (mi) |
| 26 | 50,000 |
| 28 | 66,000 |
| 31 | 78,000 |
| 35 | 81,000 |
| 38 | 74,000 |
| 42 | 70,000 |
| 45 | 59,000 |
By using graphing calculator,
and from the graphing calculator the quadratic of best fit is
b)
To plot:
The graph of the polynomial from part a).
Explanation of Solution
Given car tires need to be inflated properly. Overinflation or underinflation can cause premature treadwear. The data in the margin show tire life for different inflation values for a certain type of tire.
| Pressure (lb/in2) | Tire life (mi) |
| 26 | 50,000 |
| 28 | 66,000 |
| 31 | 78,000 |
| 35 | 81,000 |
| 38 | 74,000 |
| 42 | 70,000 |
| 45 | 59,000 |
From the table the required scatter plot is,
c)
To estimate:
The pressure that gives the longest tire life by using the result of b).
Answer to Problem 1P
Solution:
The pressure that gives the longest tire life is 35.85 lb/in2.
Explanation of Solution
Given car tires need to be inflated properly. Overinflation or underinflation can cause premature treadwear. The data in the margin show tire life for different inflation values for a certain type of tire.
| Pressure (lb/in2) | Tire life (mi) |
| 26 | 50,000 |
| 28 | 66,000 |
| 31 | 78,000 |
| 35 | 81,000 |
| 38 | 74,000 |
| 42 | 70,000 |
| 45 | 59,000 |
From the table the required scatter plot is,
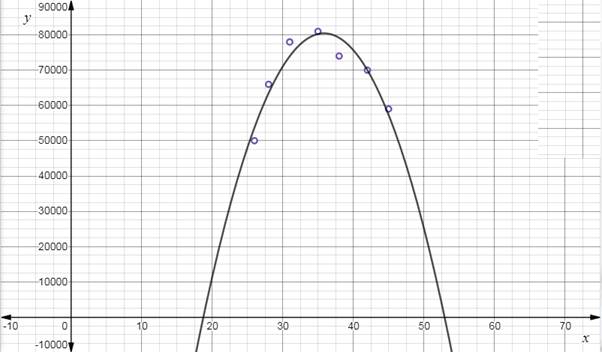
From the graph the pressure that gives the longest tire life is 35.85 lb/in2.
Want to see more full solutions like this?
Chapter 3 Solutions
ALGEBRA AND TRIGONOMETRY-WEBASSIGN


 Algebra & Trigonometry with Analytic GeometryAlgebraISBN:9781133382119Author:SwokowskiPublisher:Cengage