
Concept explainers
Videos
(a)
To sketch the scatterplot of the data using dash time as the explanatory variable.
(a)
Explanation of Solution
The data is given for the dash time and the long-jump distance in the question for the students. Thus, the scatterplot for the same is as:
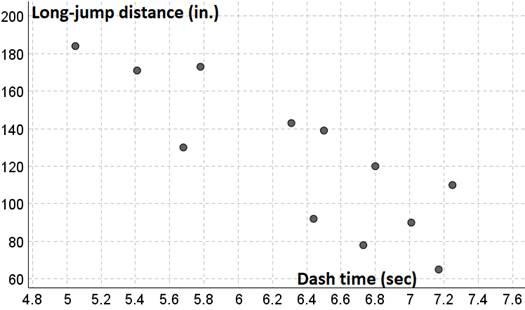
The dash time in seconds is on the horizontal axis and the long jump distance in inches is on the vertical axis.
(b)
To use the technology to calculate the equation of the least square regression line for predicting the long-jump distance based on the dash time and add the line to the scatterplot of part (a).
(b)
Answer to Problem 52E
Explanation of Solution
The data is given for the dash time and the long-jump distance in the question for the students. Now, we have to find the equation of the least squares regression line. Thus, we have,
First press on STAT and then select
Finally pressing on ENTER ten gives us the following results:
Thus the equation of the least square regression line will be as:
And the line added to the scatterplot in part (a) will be as:

(c)
To explain why the line calculated in part (b) is called the least-squares regression line.
(c)
Explanation of Solution
The data is given for the dash time and the long-jump distance in the question for the students. Thus, the regression line from part (b) is called the least-squares regression line because this is the straight line that minimizes the sum of the squared residuals. A residual is the difference between the actual y -vale and the predicted y -values.
Chapter 3 Solutions
PRACTICE OF STATISTICS F/AP EXAM
Additional Math Textbook Solutions
STATS:DATA+MODELS-W/DVD
Essentials of Statistics, Books a la Carte Edition (5th Edition)
Intro Stats, Books a la Carte Edition (5th Edition)
Statistics: The Art and Science of Learning from Data (4th Edition)
Introductory Statistics (10th Edition)


 MATLAB: An Introduction with ApplicationsStatisticsISBN:9781119256830Author:Amos GilatPublisher:John Wiley & Sons Inc
 Probability and Statistics for Engineering and th...StatisticsISBN:9781305251809Author:Jay L. DevorePublisher:Cengage Learning
 Statistics for The Behavioral Sciences (MindTap C...StatisticsISBN:9781305504912Author:Frederick J Gravetter, Larry B. WallnauPublisher:Cengage Learning
 Elementary Statistics: Picturing the World (7th E...StatisticsISBN:9780134683416Author:Ron Larson, Betsy FarberPublisher:PEARSON
 The Basic Practice of StatisticsStatisticsISBN:9781319042578Author:David S. Moore, William I. Notz, Michael A. FlignerPublisher:W. H. Freeman
 Introduction to the Practice of StatisticsStatisticsISBN:9781319013387Author:David S. Moore, George P. McCabe, Bruce A. CraigPublisher:W. H. Freeman