
Videos
A Quant jock from your firm used a linear
- Based on these estimates, write an equation that summarizes the demand for the firm’s product.
- Which regression coefficients are statistically significant at the 5 percent level?
- Comment on how well the regression line fits the data.
(a)
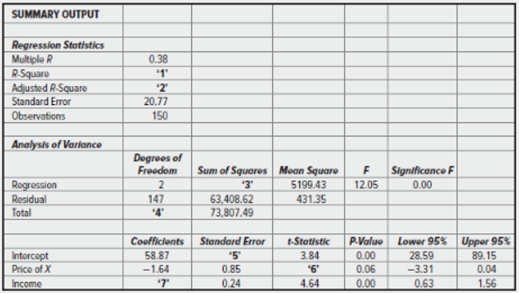
In the given table, the missing values that need to be found are:
- R-square
- Adjusted R-square
- Sum of Squares of regression
- Degree of freedom
- Standard error of Intercept
- t-statistic for price of X
- coefficient estimate of income.
To find the values of these missing terms, we need to go through the following steps:
1) R-square is computed as the ratio of the explained sum of squares of the regression to the total sum of squared errors. That is,
From the given information Sum of Squares of regression can be calculated,
The value of Sum of Squares is 10,398.87
By putting this value in formula of R-square, we get
The value of R-square is 0.141
2) The formula of adjusted R-square is:
Where r-square = 0.141
K= 3 and
n= 150
by putting these values in the formula, we get
Therefore, the value of the adjusted r-square is 0.129.
3) the value of Sum of Squares of regression is equal to 10,398.87.
4)the total degree of freedom is the sum of degree of freedom for regression and degree of freedom for residual.
Total degree of freedom = 147+2
= 149
Therefore, the value of the total degree of freedom is 149.
5) The standard error of intercept
In the table value of t-statistic and parameter, a is given. By putting these values in t-statistic formula we get,
Therefore, the value of the standard error of the intercept is equal to 15.33.
6) By using the value of coefficient and standard error we get t-statistic.
Therefore, the value of t-statistic for the price of X is equal to -1.93.
7)by using the same formula of t-statistic, the coefficient estimates of income can be found.
When we put the given information in the formula, we get
Therefore, the value of the coefficient estimate of income is equal to 1.1136.
Based on these estimates, the linear demand function of regression model.
Explanation of Solution
The demand function of is:
Here, Px is the price of good X and M is the income.
(b)
The estimates that are statistically different from zero.
Explanation of Solution
If the absolute value of the t-statistics is greater than or equal to 2, then the corresponding parameter estimate is statistically different from zero.
From the computed values and table, we have these details:
| t-statistic | |
| Intercept | 3.84 |
| Price of X | -1.93 |
| Income | 4.64 |
Since the absolute value of t-statistic for intercept and income is greater than 2, the estimated coefficient of the intercept and income at 5% significant level are statistically different from zero.
(c)
The question requires to find how well this model fit for the data.
Explanation of Solution
he values of R-square and adjusted r-square is the measurement of goodness of fit to a model. Here the value of adjusted r-square is not very different from the value of r-square. They are:
R-square = 0.141
Adjusted R-square = 0.129
The values of both the estimates are very small that means the regression equation is not able to explain the dependent variable values. Therefore, the regression line is not a good fit for the data.
Want to see more full solutions like this?
Chapter 3 Solutions
Managerial Economics & Business Strategy (Mcgraw-hill Series Economics)


- Tutorial Exercise Worldwide annual sales of smartphones in over a 5 year period were projected to be approximately q = −10p + 4,540 million phones at a selling price of $p per phone. (a) Obtain a formula for the price elasticity of demand E. (b) In one particular year the actual selling price was $277 per phone. What was the corresponding price elasticity of demand? Interpret your answer. (c) Use your formula for E to determine the selling price that would have resulted in the largest annual revenue. What, to the nearest $10 million, would have been the resulting annual revenue? Step 1 (a)Obtain a formula for the price elasticity of demand E. Recall that the price elasticity of demand E is the percentage rate of decrease of demand divided by the percentage increase of price, given by the formula. E = − dq dp · p q We are already given the formula q = −10p + 4,540 for the demand of smartphones (in millions). First, we find the derivative…arrow_forwardWrite a demand and supply curve expressed in the form of an exponential and logarithmic function respectivelyarrow_forwardWhen sold for $790.00, a certain desktop has an annual supply of 129.5 million computers and an annual demand of 155.5 million computers. When the price increases to $865.00, the annual supply increases to 147.5 million computers, and the demand drops to 134.5 million computers. NOTE: Round slope and vertical intercept to 4 decimal places and use those rounded values to the end. (a) Assuming that the supply and demand equations are linear, find the supply and demand equations. Supply Equation p = Demand Equation p = esc (Note: The equations should be in the form p = mq + b where p denotes the price (in dollars) and q denotes the quantity (in billions). The slope and y-intercept should be accurate to 4 decimal places). (b) Find the Equilibrium price and quantity. Equilibrium price p = Equilibrium quantity q = 9- F2 A (Note: The equilibrium price should be accurate to 2 decimal places and quantity should be rounded to the nearest whole number, and the equilibrium price should include a…arrow_forward
- A local firm produces three types of Pizza, for delivery to homes in the area. The owner has completed research, to discover the demand curves for each of the three pizzas. The schedules are shown below: (Quantities are per week). Price Pizza A (Qd) Pizza B (Qd) Pizza C (Qd) 12 800 0 100 11 840 0 200 10 880 400 300 9 920 800 400 8 960 1200 500 7 1000 1600 600 6 1040 2000 700 5 1080 2400 800 Plot the three demand curves, on one graph. (It does not have to be Excel). Calculate PED for all three pizzas over the price range $9 to $10. Use the midpoint formula (see your class lecture notes.) Explain why the three PED measures are different. What change would make all three PED measures become more elastic? What about more inelastic?arrow_forwardA local firm produces three types of Pizza, for delivery to homes in the area. The owner has completed research, to discover the demand curves for each of the three pizzas. The schedules are shown below: (Quantities are per week). Price Pizza A (Qd) Pizza B (Qd) Pizza C (Qd) 12 800 0 100 11 840 0 200 10 880 400 300 9 920 800 400 8 960 1200 500 7 1000 1600 600 6 1040 2000 700 5 1080 2400 800 Plot the three demand curves, on one graph. Calculate PED for all three pizzas over the price range $9 to $10. Use the midpoint formula Explain why the three PED measures are different. What change would make all three PED measures become more elastic? What about more inelastic? NB: THIS NOT A GRADED QUESTION, ITS A SAMPLE PRATICE QUESTION. THANK YOUarrow_forwardThe quantity of hot dogs buns demanded at a price of $1.59 increased from 100units to 130unite during the week that hot dogs went on sales for $1.89 rather than the regular price of $2.59. (a) what data points (P1 Q1) (P1 Q2) would you use to calculate the cross elasticity of demand for hot dogs and buns? (b) would the cross elasticity of demand be positive, zero or negative? What does this represent in economics terms? (c) the next time hot dogs went on sales, the price of buns was increased to $1.79 and only 120 buns was sold. Was this a good business decision? Why/why not?arrow_forward
- In reference to the chart, complete the calculations for Total Revenue by determining how many customers will purchase at each of the segment prices.arrow_forwardProducers of a certain brand of refrigerator will make 1600 refrigerators available when the unit price is $320. Ata unit price of $370, 5600 refrigerators will be marketed. Find the equation relating the unit price p of a refrigerator to the quantity supplied x if the equation is known to be linear How many refrigerators will be marketed when the unit price is s4207 refrigerators What is the lowest price at which a refrigerator will be marketed?arrow_forwardRogers purchased 60 tins of paracetamol at shs. 12,500 each from Abacus Pharma. Two months later the cost of a paracetamol tin increased by 35% and Tom Purchased 25 tins of paracetamol. a) Illustrate the above information on a graph. b) Calculate the price elasticity of demand and interpret your result c) Mention the demand and supply shifters of healthcare services other than pricearrow_forward
- Find the demand function.arrow_forwardAJM distributors has hired you to provide financial advice on a product being sold. They have supplied the following information: The equation: p= 40 - x 4 Using the above equation they would like you to supply information regard to pricing of one of their new products. Make an analysis of the price elasticity of demand obtained from the function given, informing all of the members of the team: -procedure of calculation -Analysis of value obtained -Explanation on how various values of elasticity can affect the profitability of the company Explain the implications (if any) by setting p at a value of $25 vs $30 Advise on how this price increase to $30, will affect the demand for the product and the profitability to the company.arrow_forwardThe demand schedule of the product is given below Price $ (P) Quantity (Q) 100 1 90 2 80 3 70 4 60 5 50 6 40 7 30 8 20 9 10 10 Calculate the arc price elasticity as the price decrease from 40 to 30$ and interpret the result. What are the determinants of price elasticity of demand?arrow_forward
