
Managerial Accounting: The Cornerstone of Business Decision-Making
7th Edition
ISBN: 9781337115773
Author: Maryanne M. Mowen, Don R. Hansen, Dan L. Heitger
Publisher: Cengage Learning
expand_more
expand_more
format_list_bulleted
Videos
Textbook Question
Chapter 3, Problem 55E
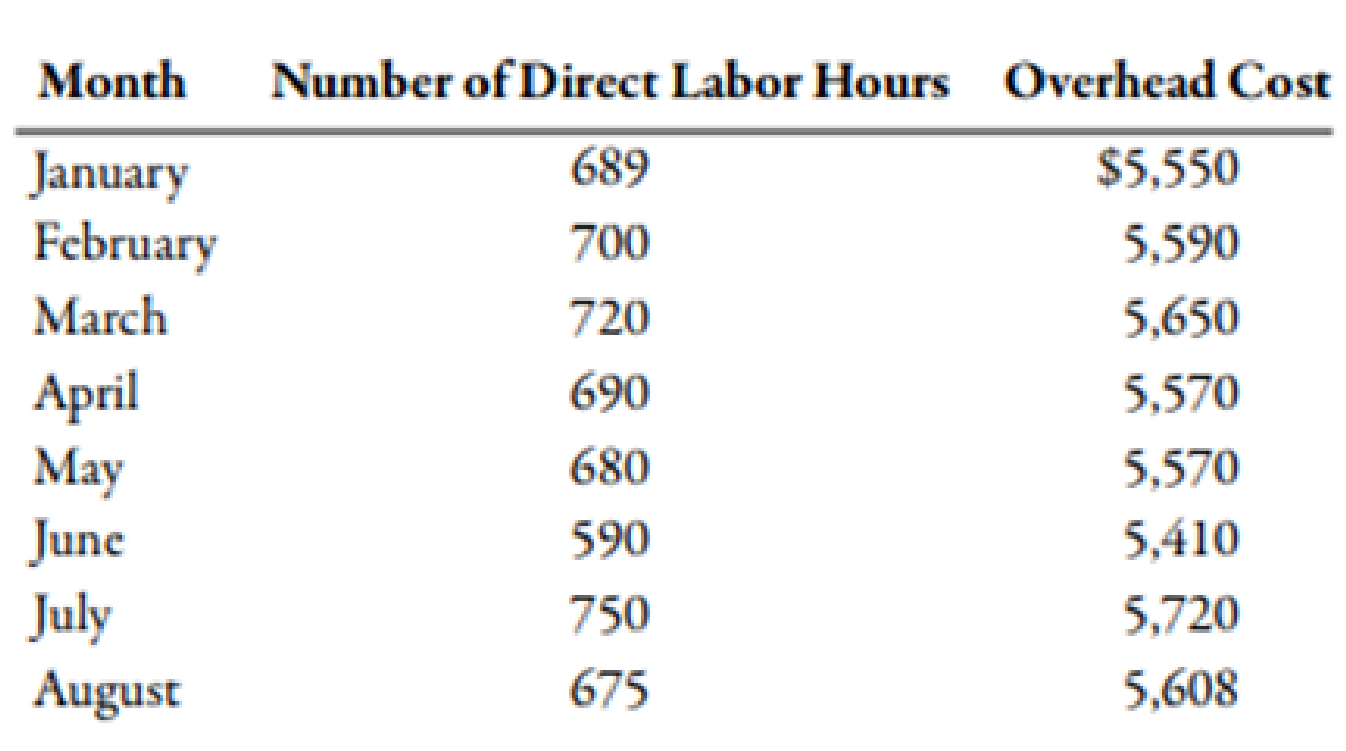
(Appendix 3A) Method of Least Squares Using Computer Spreadsheet Program
The controller for Beckham Company believes that the number of direct labor hours is associated with
Required:
- 1. Using a computer spreadsheet program such as Excel, run a regression on these data. Print out your results.
- 2. Using your results from Requirement 1, write the cost formula for overhead cost. (Note: Round the fixed cost to the nearest dollar and the variable rate to the nearest cent.)
- 3. CONCEPTUAL CONNECTION What is R2 based on your results? Do you think that the number of direct labor hours is a good predictor of factory overhead cost?
- 4. Assuming that expected September direct labor hours are 700, what is expected factory overhead cost using the cost formula in Requirement 2?
Expert Solution & Answer

Trending nowThis is a popular solution!

Students have asked these similar questions
The managing director of a consulting group has the accompanying monthly data on total overhead costs and professional labor hours to bill to clients. Complete parts a through c.
Click the icon to view the monthly data.
a. Develop a simple linear regression model between billable hours and overhead costs.
Overhead Costs = +xBillable Hours
X
Monthly Overhead Costs and Billable Hours Data
(Round the constant to one decimal place as needed. Round the coefficient to four decimal places as needed. Do not include the $ symbol in your answers.)
Overhead Costs
Billable Hours
0
$315,000
3,000
$365,000
4,000
$395,000
5,000
$447,000
6,000
$530,000
7,000
$550,000
8,000
Based on analyzing the relationship of total factory overhead (Y) to direct labor hours (X). The following relationship was found:
Y = $1,000 + $2X
The equation was probably found through the use of which of the following mathematical techniques?
The managing director of a consulting group has the accompanying monthly data on total overhead costs and professional labor hours to bill to clients. Complete parts a through c.
Click the icon to view the monthly data.
a. Develop a simple linear regression model between billable hours and overhead costs.
Overhead Costs
+(9) x Billable Hours
(Round the constant to one decimal place as needed. Round the coefficient to four decimal places as needed. Do not include the $ symbol in your answers.)
X
Monthly Overhead Costs and Billable Hours Data
Overhead Costs Billable Hours
$315,000
3,000
$360,000
4,000
$385,000
5,000
$438,000
6,000
$520,000
7,000
$540,000
8,000
D
Print
Done
Chapter 3 Solutions
Managerial Accounting: The Cornerstone of Business Decision-Making
Ch. 3 - Prob. 1DQCh. 3 - What is a driver? Give an example of a cost and...Ch. 3 - Suppose a company finds that shipping cost is...Ch. 3 - Some firms assign mixed costs to either the fixed...Ch. 3 - Explain the difference between committed and...Ch. 3 - Explain why the concept of relevant range is...Ch. 3 - Why do mixed costs pose a problem when it comes to...Ch. 3 - Describe the cost formula for a strictly fixed...Ch. 3 - Describe the cost formula for a strictly variable...Ch. 3 - What is the scattergraph method, and why is it...
Ch. 3 - Describe how the scattergraph method breaks out...Ch. 3 - What are the advantages of the scattergraph method...Ch. 3 - Prob. 13DQCh. 3 - What is meant by the best-fitting line?Ch. 3 - What is the difference between the unit cost of a...Ch. 3 - Prob. 16DQCh. 3 - (Appendix 3A) Explain the meaning of the...Ch. 3 - A factor that causes or leads to a change in a...Ch. 3 - Which of the following would probably be a...Ch. 3 - Prob. 3MCQCh. 3 - In the cost formula, the term 128,000,000 a. is...Ch. 3 - In the cost formula, the term 12,000 a. is the...Ch. 3 - Prob. 6MCQCh. 3 - Prob. 7MCQCh. 3 - The following cost formula for total purchasing...Ch. 3 - An advantage of the high-low method is that it a....Ch. 3 - Prob. 10MCQCh. 3 - Prob. 11MCQCh. 3 - Prob. 12MCQCh. 3 - The total cost for monthly supervisory cost in a...Ch. 3 - Yates Company shows the following unit costs for...Ch. 3 - (Appendix 3A) In the method of least squares, the...Ch. 3 - Creating and Using a Cost Formula Big Thumbs...Ch. 3 - Using High-Low to Calculate Fixed Cost, Calculate...Ch. 3 - Using High-Low to Calculate Predicted Total...Ch. 3 - Using High-Low to Calculate Predicted Total...Ch. 3 - Using Regression to Calculate Fixed Cost,...Ch. 3 - Inventory Valuation under Absorption Costing Refer...Ch. 3 - Inventory Valuation under Variable Costing Refer...Ch. 3 - Absorption-Costing Income Statement Refer to the...Ch. 3 - Variable-Costing Income Statement Refer to the...Ch. 3 - Creating and Using a Cost Formula Kleenaire Motors...Ch. 3 - Using High-Low to Calculate Fixed Cost, Calculate...Ch. 3 - Using High-Low to Calculate Predicted Total...Ch. 3 - Brief Exercise 3-28 Using High-Low to Calculate...Ch. 3 - Using Regression to Calculate Fixed Cost,...Ch. 3 - Inventory Valuation under Absorption Costing Refer...Ch. 3 - Inventory Valuation under Variable Costing Refer...Ch. 3 - Brief Exercise 3-32 Absorption-Costing Income...Ch. 3 - Brief Exercise 3-33 Variable-Costing Income...Ch. 3 - Variable and Fixed Costs What follows are a number...Ch. 3 - Cost Behavior, Classification Smith Concrete...Ch. 3 - Prob. 36ECh. 3 - Prob. 37ECh. 3 - Prob. 38ECh. 3 - Step Costs, Relevant Range Bellati Inc. produces...Ch. 3 - Matching Cost Behavior Descriptions to Cost...Ch. 3 - Examine the graphs in Exercise 3-40. Required: As...Ch. 3 - Prob. 42ECh. 3 - Prob. 43ECh. 3 - High-Low Method Refer to the information for Luisa...Ch. 3 - Scattergraph Method Refer to the information for...Ch. 3 - Method of Least Squares Refer to the information...Ch. 3 - Use the following information for Exercises 3-47...Ch. 3 - Use the following information for Exercises 3-47...Ch. 3 - Method of Least Squares, Developing and Using the...Ch. 3 - The method of least squares was used to develop a...Ch. 3 - Identifying the Parts of the Cost Formula;...Ch. 3 - Inventory Valuation under Absorption Costing...Ch. 3 - Inventory Valuation under Variable Costing Lane...Ch. 3 - Income Statements under Absorption and Variable...Ch. 3 - (Appendix 3A) Method of Least Squares Using...Ch. 3 - (Appendix 3A) Method of Least Squares Using...Ch. 3 - Identifying Fixed, Variable, Mixed, and Step Costs...Ch. 3 - Identifying Use of the High-Low, Scattergraph, and...Ch. 3 - Identifying Variable Costs, Committed Fixed Costs,...Ch. 3 - Scattergraph, High-Low Method, and Predicting Cost...Ch. 3 - Method of Least Squares, Predicting Cost for...Ch. 3 - Cost Behavior, High-Low Method, Pricing Decision...Ch. 3 - Prob. 63PCh. 3 - Variable and Fixed Costs, Cost Formula, High-Low...Ch. 3 - Cost Separation About 8 years ago, Kicker faced...Ch. 3 - Variable-Costing and Absorption-Costing Income...Ch. 3 - Refer to the information for Farnsworth Company...Ch. 3 - (Appendix 3A) Scattergraph, High-Low Method,...Ch. 3 - (Appendix 3A) Separating Fixed and Variable Costs,...Ch. 3 - (Appendix 3A) Cost Formulas, Single and Multiple...Ch. 3 - Suspicious Acquisition of Data, Ethical Issues...
Knowledge Booster


Learn more about
Need a deep-dive on the concept behind this application? Look no further. Learn more about this topic, accounting and related others by exploring similar questions and additional content below.Similar questions
- Scattergraph method Using the data in P4-2 and a piece of graph paper: 1. Plot the data points on the graph and draw a line by visual inspection, indicating the trend shown by the data points. 2. Determine the variable cost per unit and the total fixed cost from the information on the graph. 3. Determine the variable cost to be charged to the product for the year. 4. Determine the fixed cost to be charged to factory overhead for the year. 5. Do these answers agree with the answers to P4-2? Why or why not?arrow_forwardUsing the data in P4-2 and Microsoft Excel: 1. Separate the variable and fixed elements. 2. Determine the cost to be charged to the product for the year. 3. Determine the cost to be charged to factory overhead for the year. 4. Determine the plotted data points using Chart Wizard. 5. Determine R2. 6. How do these solutions compare to the solutions in P4-2 and P4-3? 7. What does R2 tell you about this cost model?arrow_forwardPlease use the information from this problem for these calculations. After grouping cost pools and estimating overhead and activities, Box Springs determined these rates: Box Springs estimates there will be four orders in the next year, and those jobs will involve: What is the total cost of the jobs?arrow_forward
- Matching graphs with descriptions of cost and revenue behavior. (D. Green, adapted) Given here are a number of graphs. The horizontal axis of each graph represents the units produced over the year, and the vertical axis represents total cost or revenues. Indicate by number which graph best fits the situation or item described (a–h). Some graphs may be used more than once; some may not apply to any of the situations. Direct material costs Supervisors’ salaries for one shift and two shifts A cost-volume-profit graph Mixed costs—for example, car rental fixed charge plus a rate per mile driven Depreciation of plant, computed on a straight-line basis Data supporting the use of a variable-cost rate, such as manufacturing labor cost of $14 per unit produced Incentive bonus plan that pays managers $0.10 for every unit produced above some level of production Interest expense on $2 million borrowed at a fixed rate of interestarrow_forwardi) Using the high-low method derive the cost function that can be used to predict the Sales&Marketing department overhead cost using the Number of Baby Powder OrdersReceived during the month (X1) as the activity level. ii) Using the high-low method derive the cost function that can be used to predict the Sales&Marketing department overhead cost using the Total weight of Baby Powder sold duringthe month in Kgs (X2)as the activity level iii) Using the cost function derived in (i) above using the Number of Baby Powder OrdersReceived during the month (X1) as the activity level estimate the Sales &Marketingdepartment overhead cost for the month of September 2021 where the Number of BabyPowder Orders Received is expected to be 1,800 orders iv) Using the cost function derived in (ii) above using the Total weight of Baby Powder soldduring the month in Kgs (X2) as the activity level estimate the Sales &Marketingdepartmentoverhead cost for the month of September 2021 where Total…arrow_forwardQuestion: Use the high-low method to determine the estimating cost function with machine-hours as the cost If July's estimated machine-hours are 4,500, calculate the total estimated operating costs of the Machining Department using the cost function in (a)? Max has used least squares regression analysis to obtain the following output:arrow_forward
- The managerial accountant at Sunny Manufacturing needs to determine how many costs are fixed costs and how many costs are variable costs in the organization. The managerial accountant reported the following information: Use the high-low method to determine the cost equation and use machine hours as the base for a cost driver in the analysis. For the toolbar, press ALT+F10 (PC) or ALT+FN+F10 (Mac). Month Machine-Hours Total Cost January 1,800 $21,500 February 2,900 $23,200 March 1,000 $19,750 April 2,400 $21,000 May 3,400 $23,900arrow_forwardBuild a spreadsheet: Construct and excel spreadsheet to solve all of the preceding requirements. Show how both cost schedules and the income statement will change if raw material purchases amounted to $190,000 and indirect labor was $20,000.arrow_forwardRefer to the data given below.Required:1. Draw a scatter diagram and graph the company’s energy cost behavior using the visual-fit method.2. Predict the energy cost for a month in which 26,000 pints of applesauce are produced.3. What peculiarity is apparent from the scatter diagram? What should the cost analyst do?arrow_forward
- question is in image. Required: Prepare a schedule of cost of goods manufactured. Prepare a schedule of cost of goods sold. Prepare an income statement. Build a spreadsheet: Construct an Excel spreadsheet to solve all of the preceding requirements. Show how both cost schedules and the income statement will change if the following data change: direct labor is $390,000 and utilities cost $35,000.arrow_forwardPlease use the information from this problem for these calculations. After grouping cost pools and estimating overhead and activities, Box Springs determined these rates: It estimates there will be five orders in the next year, and those jobs will involve: What is the total cost of the jobs?arrow_forwardMethod of Least Squares, Predicting Cost for Different Time Periods from the One Used to Develop a Cost Formula Refer to the information for Farnsworth Company on the previous page. However, assume that Tracy has used the method of least squares on the receiving data and has gotten the following results: Required: 1. Using the results from the method of least squares, prepare a cost formula for the receiving activity. 2. Using the formula from Requirement 1, what is the predicted cost of receiving for a month in which 1,450 receiving orders are processed? (Note: Round your answer to the nearest dollar.) 3. Prepare a cost formula for the receiving activity for a quarter. Based on this formula, what is the predicted cost of receiving for a quarter in which 4,650 receiving orders are anticipated? Prepare a cost formula for the receiving activity for a year. Based on this formula, what is the predicted cost of receiving for a year in which 18,000 receiving orders are anticipated?arrow_forward
arrow_back_ios
SEE MORE QUESTIONS
arrow_forward_ios
Recommended textbooks for you
 Managerial Accounting: The Cornerstone of Busines...AccountingISBN:9781337115773Author:Maryanne M. Mowen, Don R. Hansen, Dan L. HeitgerPublisher:Cengage Learning
 Cornerstones of Cost Management (Cornerstones Ser...AccountingISBN:9781305970663Author:Don R. Hansen, Maryanne M. MowenPublisher:Cengage Learning
 Excel Applications for Accounting PrinciplesAccountingISBN:9781111581565Author:Gaylord N. SmithPublisher:Cengage Learning
 Principles of Cost AccountingAccountingISBN:9781305087408Author:Edward J. Vanderbeck, Maria R. MitchellPublisher:Cengage Learning
 Managerial AccountingAccountingISBN:9781337912020Author:Carl Warren, Ph.d. Cma William B. TaylerPublisher:South-Western College Pub
 Principles of Accounting Volume 2AccountingISBN:9781947172609Author:OpenStaxPublisher:OpenStax College
Managerial Accounting: The Cornerstone of Busines...
Accounting
ISBN:9781337115773
Author:Maryanne M. Mowen, Don R. Hansen, Dan L. Heitger
Publisher:Cengage Learning
Cornerstones of Cost Management (Cornerstones Ser...
Accounting
ISBN:9781305970663
Author:Don R. Hansen, Maryanne M. Mowen
Publisher:Cengage Learning
Excel Applications for Accounting Principles
Accounting
ISBN:9781111581565
Author:Gaylord N. Smith
Publisher:Cengage Learning
Principles of Cost Accounting
Accounting
ISBN:9781305087408
Author:Edward J. Vanderbeck, Maria R. Mitchell
Publisher:Cengage Learning
Managerial Accounting
Accounting
ISBN:9781337912020
Author:Carl Warren, Ph.d. Cma William B. Tayler
Publisher:South-Western College Pub
Principles of Accounting Volume 2
Accounting
ISBN:9781947172609
Author:OpenStax
Publisher:OpenStax College
How to Estimate Project Costs: A Method for Cost Estimation; Author: Online PM Courses - Mike Clayton;https://www.youtube.com/watch?v=YQ2Wi3Jh3X0;License: Standard Youtube License