
Business Analytics
3rd Edition
ISBN: 9780135231715
Author: Evans
Publisher: PEARSON
expand_more
expand_more
format_list_bulleted
Question
Chapter 3, Problem 2PE
To determine
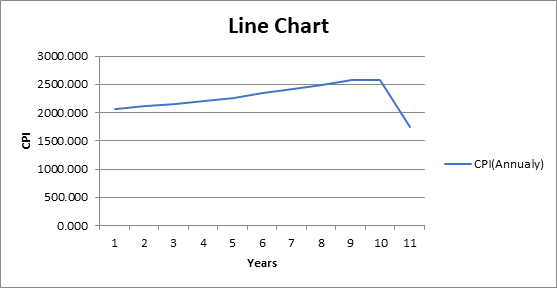
To create a line chart showing the growth in the annual CPI.
Expert Solution & Answer
Explanation of Solution
Given:
The Consumer price index excel file data is as follows:
| Consumer Price Index - All Urban Consumers | Bureau of Labor Statistics | |||||||||||
| Year | Jan | Feb | Mar | Apr | May | Jun | Jul | Aug | Sep | Oct | Nov | Dec |
| 2000 | 169.300 | 170.000 | 171.000 | 170.900 | 171.200 | 172.200 | 172.700 | 172.700 | 173.600 | 173.900 | 174.200 | 174.600 |
| 2001 | 175.600 | 176.000 | 176.100 | 176.400 | 177.300 | 177.700 | 177.400 | 177.400 | 178.100 | 177.600 | 177.500 | 177.400 |
| 2002 | 177.700 | 178.000 | 178.500 | 179.300 | 179.500 | 179.600 | 180.000 | 180.500 | 180.800 | 181.200 | 181.500 | 181.800 |
| 2003 | 182.600 | 183.600 | 183.900 | 183.200 | 182.900 | 183.100 | 183.700 | 184.500 | 185.100 | 184.900 | 185.000 | 185.500 |
| 2004 | 186.300 | 186.700 | 187.100 | 187.400 | 188.200 | 188.900 | 189.100 | 189.200 | 189.800 | 190.800 | 191.700 | 191.700 |
| 2005 | 191.600 | 192.400 | 193.100 | 193.700 | 193.600 | 193.700 | 194.900 | 196.1000 | 198.800 | 199.100 | 198.100 | 198.100 |
| 2006 | 199.200 | 199.400 | 199.700 | 200.600 | 201.400 | 201.900 | 202.900 | 203.700 | 202.900 | 201.800 | 202.000 | 203.100 |
| 2007 | 203.372 | 204.258 | 205.312 | 205.959 | 206.850 | 207.202 | 207.651 | 207.671 | 208.503 | 209.073 | 210.740 | 211.434 |
| 2008 | 212.225 | 212.703 | 213.543 | 214.106 | 215.287 | 217.279 | 219.102 | 218.779 | 218.846 | 216.832 | 212.923 | 211.339 |
| 2009 | 211.959 | 212.877 | 212.643 | 212.810 | 213.050 | 214.558 | 214.774 | 215.566 | 215.911 | 216.357 | 216.859 | 217.224 |
| 2010 | 217.587 | 217.591 | 217.729 | 217.579 | 217.224 | 216.929 | 217.597 | 218.150 | ||||
Calculation:
Since, we have to show the line chart for the growth in annual CPI. Thus, we have to take the sum of the months yearly basis. We will use the formula for sum, such as,
=SUM(number1,[number2],...])
Thus the result will be as:
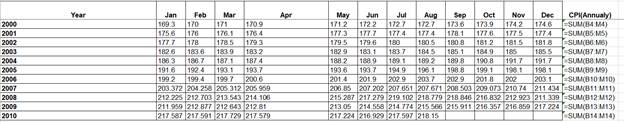
And the outcome will be:
| Year | Jan | Feb | Mar | Apr | May | Jun | Jul | Aug | Sep | Oct | Nov | Dec | CPI(Annualy) |
| 2000 | 169.300 | 170.000 | 171.000 | 170.900 | 171.200 | 172.200 | 172.700 | 172.700 | 173.600 | 173.900 | 174.200 | 174.600 | 2066.300 |
| 2001 | 175.600 | 176.000 | 176.100 | 176.400 | 177.300 | 177.700 | 177.400 | 177.400 | 178.100 | 177.600 | 177.500 | 177.400 | 2124.500 |
| 2002 | 177.700 | 178.000 | 178.500 | 179.300 | 179.500 | 179.600 | 180.000 | 180.500 | 180.800 | 181.200 | 181.500 | 181.800 | 2158.400 |
| 2003 | 182.600 | 183.600 | 183.900 | 183.200 | 182.900 | 183.100 | 183.700 | 184.500 | 185.100 | 184.900 | 185.000 | 185.500 | 2208.000 |
| 2004 | 186.300 | 186.700 | 187.100 | 187.400 | 188.200 | 188.900 | 189.100 | 189.200 | 189.800 | 190.800 | 191.700 | 191.700 | 2266.900 |
| 2005 | 191.600 | 192.400 | 193.100 | 193.700 | 193.600 | 193.700 | 194.900 | 196.1000 | 198.800 | 199.100 | 198.100 | 198.100 | 2343.200 |
| 2006 | 199.200 | 199.400 | 199.700 | 200.600 | 201.400 | 201.900 | 202.900 | 203.700 | 202.900 | 201.800 | 202.000 | 203.100 | 2418.600 |
| 2007 | 203.372 | 204.258 | 205.312 | 205.959 | 206.850 | 207.202 | 207.651 | 207.671 | 208.503 | 209.073 | 210.740 | 211.434 | 2488.025 |
| 2008 | 212.225 | 212.703 | 213.543 | 214.106 | 215.287 | 217.279 | 219.102 | 218.779 | 218.846 | 216.832 | 212.923 | 211.339 | 2582.964 |
| 2009 | 211.959 | 212.877 | 212.643 | 212.810 | 213.050 | 214.558 | 214.774 | 215.566 | 215.911 | 216.357 | 216.859 | 217.224 | 2574.588 |
| 2010 | 217.587 | 217.591 | 217.729 | 217.579 | 217.224 | 216.929 | 217.597 | 218.150 | 1740.386 |
Then, we will construct the line chart by selecting the last column of CPI (annually) of the sums of the months year wise and then go to the insert button and then click on the line chart and the line chart is created,
The line chart is as follows:
Want to see more full solutions like this?
Subscribe now to access step-by-step solutions to millions of textbook problems written by subject matter experts!
Students have asked these similar questions
Assist the analyst to obtain the index value forecasts
Use the graph on the right from a central bank that summarizes the amount of student loan obligation
If the EPA sets a level of 0.08 as a maximum safe ozone level, what percent of the total number of days measured on the above graph exceed safe levels?
Chapter 3 Solutions
Business Analytics
Ch. 3 - Prob. 2PECh. 3 - Create a line chart for the closing prices for all...Ch. 3 - Create a pie chart showing the breakdown of...Ch. 3 - Create a stacked area chart contrasting primary...Ch. 3 - A national homebuilder builds single-family homes...Ch. 3 - The Excel file Facebook Survey provides data...Ch. 3 - Create a bubble chart for the first five colleges...Ch. 3 - Construct a column chart for the data in the Excel...Ch. 3 - The Excel file Internet Usage provides data about...Ch. 3 - Construct an appropriate chart to show the...
Ch. 3 - A marketing researcher surveyed 92 individuals,...Ch. 3 - In the Excel file Banking Data, apply the...Ch. 3 - Apply three different colors of data bars to...Ch. 3 - For the Store and Regional Sales database, apply a...Ch. 3 - For the Excel file Closing Stock Prices, apply...Ch. 3 - Create a useful dashboard for the data in the...Ch. 3 - Create a useful dashboard for the data in the...Ch. 3 - Create a useful dashboard for the data in the...
Knowledge Booster

Similar questions
- The data shows the price of silver and the price of tin over a recent 9 year period.arrow_forwarddiscuss the trend analysis of the oil palm pricingarrow_forwardDuring periods when the unadjusted federal minimum wage is constant, identify the trend that you observe in the adjusted federal minimum wage and the explain why that trend occursarrow_forward
- Calculate the mean percent of African American persons living below the poverty level. This will be the third columnarrow_forwardThe unadjusted federal minimum wage has been a constant value of $7.25 since 2009. What trend do you observe in the adjusted federal minimum wage from 2009 to 2020. explain why this trend occurs.arrow_forwardDuring what years did home prices decrease? increase?arrow_forward
- Create a descriptive summary of the Revenue variable of the data.arrow_forwardAccording to the World Bank (Source: http://data.worldbank.org/indicator/ IT.CEL. SETS/countries/1W?display=graph), the total numbers of mobile phone sub- scriptions in 2008 and 2012 are 4,028,070,041 and 6,264,810,140, respectively. Find the average rate of growth (number of subscriptions per year).arrow_forwardthe following table provides the average price of regular grade gasoline for 4 years. Use 2015 as the reference value, complete the table by calculating the price index for each year. Show all your calculationarrow_forward
- The consumer price index (CPI) rose from 106.7 to 124.9, while Helen's net salary didn't change at all. Calculate the relative real change in Helen's salary (purchasing power) as percentage.arrow_forwardFind the 3 year period moving average for 2008arrow_forwardIn the last three years, there have been changes of 55%, 3% and 2% in the production amount of a good, respectively. What is the geometric mean of the annual rate of change?arrow_forward
arrow_back_ios
SEE MORE QUESTIONS
arrow_forward_ios
Recommended textbooks for you
 College Algebra (MindTap Course List)AlgebraISBN:9781305652231Author:R. David Gustafson, Jeff HughesPublisher:Cengage Learning
 Glencoe Algebra 1, Student Edition, 9780079039897...AlgebraISBN:9780079039897Author:CarterPublisher:McGraw Hill
College Algebra (MindTap Course List)
Algebra
ISBN:9781305652231
Author:R. David Gustafson, Jeff Hughes
Publisher:Cengage Learning
Glencoe Algebra 1, Student Edition, 9780079039897...
Algebra
ISBN:9780079039897
Author:Carter
Publisher:McGraw Hill