
Introductory Statistics (2nd Edition)
2nd Edition
ISBN: 9780321978271
Author: Robert Gould, Colleen N. Ryan
Publisher: PEARSON
expand_more
expand_more
format_list_bulleted
Concept explainers
Videos
Textbook Question
Chapter 3, Problem 12SE
Education of Father and Mother The table shows Minitab descriptive statics foe the years of education for the father and mother of students in one of the author’s statics classes and in one of her pre-algebra classes. Twelve years is equivalent to a high school education.
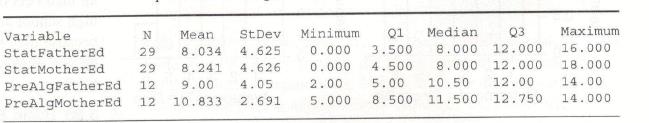
a. Are the
b. In pre-algebra, is the means higher fore the mothers or fathers?
c. Which of the four group has the smallest standard deviation (StDev)?
Expert Solution & Answer
Want to see the full answer?
Check out a sample textbook solution
Chapter 3 Solutions
Introductory Statistics (2nd Edition)
Ch. 3 - Earnings A sociologist says, “Typically, men in...Ch. 3 - Houses A real estate agent claims that all things...Ch. 3 - Age of CEOs (Example) the histogram shows the ages...Ch. 3 - Televisions The histogram shows the number of...Ch. 3 - Billionaires According to Forbes.com, the numbers...Ch. 3 - Billionaires According to Forbes.com, the numbers...Ch. 3 - Paid Vacation Days (Example 2) This list...Ch. 3 - Children of First Ladies This list represents the...Ch. 3 - Ages of Presidents at Inauguration At their...Ch. 3 - Ages of Chief Justices at Installation At their...
Ch. 3 - Weight Loss (Example 3) The table shows Minitab...Ch. 3 - Education of Father and Mother The table shows...Ch. 3 - Surfing College students and surfers Rex Robinson...Ch. 3 - Eating Out College student Jacqueline Loya asked a...Ch. 3 - Real state price (Example) look at the two...Ch. 3 - Dice The histogram contain data with a range of 1...Ch. 3 - Birth Weights (Example 5) The mean birth weigh for...Ch. 3 - Birth Length The mean birth length for U.S....Ch. 3 - Children’s Ages (Example 6) Mrs. Johnson’s...Ch. 3 - Pay Rate in Different Currencies The pay rates for...Ch. 3 - Olympics In the most recent summer Olympics, do...Ch. 3 - Weights Suppose you have a data set with the...Ch. 3 - Brain Size The brain size (in hundreds of...Ch. 3 - Happiness A survey on StatCrunch asked people to...Ch. 3 - Drinkers The number of alcoholic drinks per week...Ch. 3 - Prob. 26SECh. 3 - Violent Crime: West (Example 7) In 2011, the mean...Ch. 3 - Violent Crime: East In 2011, the mean rate of...Ch. 3 - Property Crime (Example 8) In 2011, the mean...Ch. 3 - Property Crime In 2011, the mean property crime...Ch. 3 - Heights and z-Scores The dotplot shows heights of...Ch. 3 - Heights Refer to the dotplot in the previous...Ch. 3 - Unusual IQs (Example 9) Wechsler IQ tests have a...Ch. 3 - Lengths of Pregnancy Distributions of gestation...Ch. 3 - Low-Birth-Weight Babies (Example 10) Babies born...Ch. 3 - Birth Lengths Babies born after 40 weeks gestation...Ch. 3 - Women's Heights Assume that women's heights have a...Ch. 3 - SATs The quantitative portion of the SAT exam has...Ch. 3 - Name two measures of the center of a distribution,...Ch. 3 - Name two measures of the variation of a...Ch. 3 - Pixar Animated Movies (Example 11) The ten...Ch. 3 - DreamWorks Animated Movies The ten top-grossing...Ch. 3 - Pixar Animated Movies Again (Example 12) Find the...Ch. 3 - Dreamworks Animated Movies Find the median and...Ch. 3 - Prob. 45SECh. 3 - Drinks The number of alcoholic drinks per week is...Ch. 3 - Outliers a. In your own words, describe to someone...Ch. 3 - Center and Variation When you are comparing two...Ch. 3 - An Error A dieter recorded the number of calories...Ch. 3 - Baseball Strike In 1994, Major League Baseball...Ch. 3 - Heads The graphs show the circumferences of heads...Ch. 3 - House Prices The graphs show the house prices (in...Ch. 3 - Shoes (Example 14) The histograms show the number...Ch. 3 - Tax Rate A StatCrunch survey asked people what...Ch. 3 - Regional Population Density The figure shows the...Ch. 3 - Property Crime Rates The boxplot shows the...Ch. 3 - City Temperatures The boxplot shows temperatures...Ch. 3 - Brain Size The boxplots show the brain size (in...Ch. 3 - Matching Boxplots and Histograms a. Report the...Ch. 3 - Matching Boxplots and Histograms Match each of the...Ch. 3 - Sleep Time of Animals Data at this text's website...Ch. 3 - BA Percentage The data show the percentage of...Ch. 3 - Tall Buildings The dotplot shows the distribution...Ch. 3 - Passing the Bar Exam The dotplot shows the...Ch. 3 - Exam Scores The five-number summary for a...Ch. 3 - Exam Scores The five-number summary for a...Ch. 3 - Death Row: South (Example 15) The table shows the...Ch. 3 - Death Row: West The table shows the numbers of...Ch. 3 - Head Circumference (Example 16) Following are head...Ch. 3 - Heights of Sons and Dads The data at this text’s...Ch. 3 - Final Exam Grades The data that follow are final...Ch. 3 - Speeding Tickets College students Diane Glover and...Ch. 3 - Heights The following graph shows the heights for...Ch. 3 - Marathon Times The following histogram of marathon...Ch. 3 - Soda Consumption A StatCrunch survey asked people...Ch. 3 - Holiday Spending A StatCrunch survey asked people...Ch. 3 - a. State an approximate value for the mean height...Ch. 3 - Ideal Family In 2012, the General Social Survey...Ch. 3 - For exercises 3.85 through 3.88, construct two...Ch. 3 - For exercises 3.85 through 3.88, construct two...Ch. 3 - For exercises 3.85 through 3.88, construct two...Ch. 3 - 3.79-3.82 construct two sets of numbers with at...Ch. 3 - Population Density Data were recorded for each of...Ch. 3 - Population Increase Data were recorded for each of...Ch. 3 - Prob. 85CRECh. 3 - Eating Out, Again College student Jacqueline Loya...Ch. 3 - Study Hours A group of 50 statistics students, 25...Ch. 3 - Driving Accidents College student Sandy Hudson...Ch. 3 - Exam Scores An exam has a mean of 70 and a...Ch. 3 - Boys’ Heights Three-year-old boys in the United...Ch. 3 - SAT and ACT Scores Quantitative SAT scores have a...Ch. 3 - Children’s Heights Mrs. Diaz has two children: a...Ch. 3 - Students’ Ages Here are the ages of some students...Ch. 3 - House Prices The figure, which is from data taken...
Knowledge Booster


Learn more about
Need a deep-dive on the concept behind this application? Look no further. Learn more about this topic, statistics and related others by exploring similar questions and additional content below.Similar questions
- Broadway The ordered pairs below give the starting year and gross ticket sales S (in millions of dollars) for each Broadway season in New York City from 1997 through 2014. 1997,558 2003,771 2009,1020 1998,588 2004,769 2010,1081 1999,603 2005,862 2011,1139 2000,666 2006,939 2012,1139 2001,643 2007,938 2013,1269 2002,721 2008,943 2014,1365 (a) Use a graphing utility to create a scatter plot of the data. Let t=7 represent 1997. (b) Use the regression feature of the graphing utility to find the equation of the least squares regression line that fits the data. (c) Use the graphing utility to graph the scatter plot you created in part (a) and the model you found in part (b) in the same viewing window. How closely does the model represent the data? (d) Use the model to predict the gross ticket sales during the season starting in 2021. (e) Interpret the meaning of the slope of the linear model in the context of the problem.arrow_forwardOTHER APPLICATIONS Car Accidents The tables in the next columns give the death rates, per million person trips, for male and female drivers for various ages and number of passengers. Male Drivers Number of Passengers Age 0 1 2 3 16 2.61 4.39 6.29 9.08 17 1.63 2.77 4.61 6.92 30-59 0.92 0.75 0.62 0.54 Female Drivers Number of Passengers Age 0 1 2 3 16 1.38 1.72 1.94 3.31 17 1.26 1.48 2.82 2.28 30-59 0.41 0.33 0.27 0.40 a. Write a matrix for death rate of male drivers. b. Write a matrix for death rate of female drivers. c. Use the matrices from parts a and b to write a matrix showing the difference between the death rates of males and females. d. Analyze the results of part c and make some suggestions on how to reduce the rates.arrow_forwardRunning In 1987, Canadian Ben Johnson set a world record in the 100-m sprint.The record was later taken away when he was found to have used an anabolic steroid to enhance his performance. His speed at various times in the race is given in the following table . Source: Information Graphics. Timesec Speedmph 0 0 1.84 12.9 3.80 23.8 6.38 26.3 7.23 26.3 8.96 26.0 9.83 25.7 a. Use the information in the table and left endpoints to estimate the distance that Johnson ran in miles. You will first need to calculate t for each interval. At the end, you will need to divide by 3600 the number of seconds in an hour, since the speed is in miles per hour. b. Repeat part a, using right endpoints. c. Wait a minute, we know that the distance Johnson ran is 100m. Divide this by 1609, the number of meters in a mile, to find how far Johnson ran in miles. Is your answer from part a or part b closer to the true answer? Briefly explain why you think this answer should be more accurate. d.arrow_forward
Recommended textbooks for you
 Calculus For The Life SciencesCalculusISBN:9780321964038Author:GREENWELL, Raymond N., RITCHEY, Nathan P., Lial, Margaret L.Publisher:Pearson Addison Wesley,
 Algebra & Trigonometry with Analytic GeometryAlgebraISBN:9781133382119Author:SwokowskiPublisher:Cengage
 Big Ideas Math A Bridge To Success Algebra 1: Stu...AlgebraISBN:9781680331141Author:HOUGHTON MIFFLIN HARCOURTPublisher:Houghton Mifflin Harcourt
 College Algebra (MindTap Course List)AlgebraISBN:9781305652231Author:R. David Gustafson, Jeff HughesPublisher:Cengage Learning
 Holt Mcdougal Larson Pre-algebra: Student Edition...AlgebraISBN:9780547587776Author:HOLT MCDOUGALPublisher:HOLT MCDOUGAL
Calculus For The Life Sciences
Calculus
ISBN:9780321964038
Author:GREENWELL, Raymond N., RITCHEY, Nathan P., Lial, Margaret L.
Publisher:Pearson Addison Wesley,
Algebra & Trigonometry with Analytic Geometry
Algebra
ISBN:9781133382119
Author:Swokowski
Publisher:Cengage
Big Ideas Math A Bridge To Success Algebra 1: Stu...
Algebra
ISBN:9781680331141
Author:HOUGHTON MIFFLIN HARCOURT
Publisher:Houghton Mifflin Harcourt
College Algebra (MindTap Course List)
Algebra
ISBN:9781305652231
Author:R. David Gustafson, Jeff Hughes
Publisher:Cengage Learning
Holt Mcdougal Larson Pre-algebra: Student Edition...
Algebra
ISBN:9780547587776
Author:HOLT MCDOUGAL
Publisher:HOLT MCDOUGAL
Propositional Logic, Propositional Variables & Compound Propositions; Author: Neso Academy;https://www.youtube.com/watch?v=Ib5njCwNMdk;License: Standard YouTube License, CC-BY
Propositional Logic - Discrete math; Author: Charles Edeki - Math Computer Science Programming;https://www.youtube.com/watch?v=rL_8y2v1Guw;License: Standard YouTube License, CC-BY
DM-12-Propositional Logic-Basics; Author: GATEBOOK VIDEO LECTURES;https://www.youtube.com/watch?v=pzUBrJLIESU;License: Standard Youtube License
Lecture 1 - Propositional Logic; Author: nptelhrd;https://www.youtube.com/watch?v=xlUFkMKSB3Y;License: Standard YouTube License, CC-BY
MFCS unit-1 || Part:1 || JNTU || Well formed formula || propositional calculus || truth tables; Author: Learn with Smily;https://www.youtube.com/watch?v=XV15Q4mCcHc;License: Standard YouTube License, CC-BY