
Concept explainers
Videos
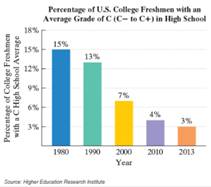
Mediocre Grade Deflation. The bar graph shows the percentage of U.S. college freshmen with an average grade of C in high school.
The data displayed by the bar graph can be described by the mathematical model
106.
a. According to the formula, in 2000, what percentage of U.S. college freshmen had an average grade of C in high school? Does this underestimate or overestimate the percent displayed by the bar graph? By how much?
b. According to the formula, how many years after 1980 will no more than 0.8% of college freshmen have an average grade of C in high school? Which years does this include?
Want to see the full answer?
Check out a sample textbook solution
Chapter 2 Solutions
Introductory Algebra for College Students (7th Edition)


- The bar graph shows the percentage of U.S.college freshmen with an average grade of A in high school.The data displayed by the bar graph can be described by the mathematical modelwhere x is the number of years after 1980 and p is the percentage of U.S. college freshmen who had an average grade of A in high school. a. According to the formula, in 2000, what percentage of U.S. college freshmen had an average grade of A in high school? Does this underestimate or overestimate the percent displayed by the bar graph? By how much?b. If trends shown by the formula continue, project when 65% of U.S. college freshmen will have had an average grade of A in high school.arrow_forwardDetermine the values of h and K above diagram.arrow_forwardThe percentage of full-time instructors at colleges and universities in some country can be modeled by the equation y=-0.034x2-0.068x+62.104, where x is the number of years since 1990. a. Use the model to estimate the percentage of full time instructors in the year 2031. According to the model,____% of instructors will be full time instructors in 2031.arrow_forward
- brett expects that each guest 0.2 of a sandwich. sketch a model to show how many sandwiches brett expects the guests to eat in all.arrow_forwardThe boxplots show data for state and local community expenditures on hospitals and highways. Hospitals Estimate Q,, Q2, and Q, for hospital and highway spending. Highways 4 Billions of Dollars Q, for hospital spending is. (Round to one decimal place as needed.) Q, for hospital spending isO: (Round to one decimal place as needed.)arrow_forwardThe bar graph shows the percentage of U.S. college freshmen with an average grade of A in high school.The data displayed by the bar graph can be described by the mathematical modelwhere x is the number of years after 1980 and p is the percentage of U.S. college freshmen who had an average grade of A in high school a. According to the formula, in 2010, what percentage of U.S. college freshmen had an average grade of A in high school? Does this underestimate or overestimate the percent displayed by the bar graph? By how much?b. If trends shown by the formula continue, project when 57% of U.S. college freshmen will have had an average grade of A in high school.arrow_forward
- Solve for x. 3 6.arrow_forwardThe number y of hits a new website receives each month can be modeled by y = 4040ekt, where t represents the number of months the website has been operating. In the website's third month, there were 9,000 hits. Find the value of k. (Round your answer to four decimal places.)arrow_forwardThe equation n = 0.03t² 0.58t + 3.98, models, n, the number (in millions) of people who moved to another state in the year that is t years since 1990. The table below shows some of the data that were used to find this model. Year 1995 1998 2001 2004 2006 Number of People Who Moved to Another State (millions) a. When t = 1.8 1.2 1.1 1.5 2.1 0 what is the value of n? What does it mean in this situation? Select an answer b. Estimate the number of people who moved to another state in 2005. million (Round to the nearest tenth of a million.) c. Predict the number of people who moved to another state in 2014. million (Round to the nearest tenth of a million.)arrow_forward
 Algebra & Trigonometry with Analytic GeometryAlgebraISBN:9781133382119Author:SwokowskiPublisher:Cengage
 College Algebra (MindTap Course List)AlgebraISBN:9781305652231Author:R. David Gustafson, Jeff HughesPublisher:Cengage Learning
 Calculus For The Life SciencesCalculusISBN:9780321964038Author:GREENWELL, Raymond N., RITCHEY, Nathan P., Lial, Margaret L.Publisher:Pearson Addison Wesley,