
Principles of Economics 2e
2nd Edition
ISBN: 9781947172364
Author: Steven A. Greenlaw; David Shapiro
Publisher: OpenStax
expand_more
expand_more
format_list_bulleted
Textbook Question
Chapter 24, Problem 61P
Table 24.4 describes Santher’s economy.
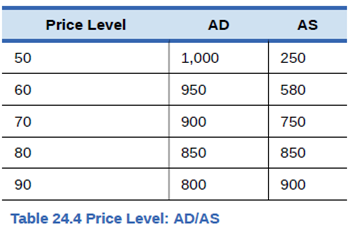
- Plot the AD/AS curves and identify the equilibrium.
- Would you expect
unemployment in this economy to be relatively high or low? - Would you expect prices to be a relatively large or small concern for this economy?
- Imagine that input prices fall and so AS shifts to the right by 150 units. Identify the new equilibrium.
- How will the shift in AS affect the original output, price level, and employment?
Expert Solution & Answer

Trending nowThis is a popular solution!

Students have asked these similar questions
Suppose firms are optimistic about the outlook of the economy and they decide to increase investment. Also suppose that, simultaneously, there is a reduction in business taxes. Use the AD-AS graph to show what happens to the price level and output as a result.
In 2014, China’s economy slowed significantly causing a decrease in demand for US exports. Use the AD/AS model to explain the likely short run impacts on US GDP and the aggregate price level. What do you anticipate will happen to US consumption expenditure and US employment? Please explain your reasoning for each of your predictions and show graphically as appropriate.
The table below shows information on aggregate supply, aggregate demand and the price level for the imaginary country of Xurbia.
Price Level
AD
AS
110
700
600
120
690
640
130
680
680
140
670
720
150
660
740
160
650
760
170
640
770
Plot the AD/AS diagram from the data shown (Don't have to show graph but do draw it to help you answer the questions).
a. Identify the equilibrium.
b. Imagine that as a result of a government tax cut, aggregate demand becomes higher by 50 at every price level. Identify the new equilibrium.
c. How will the new equilibrium alter output? How will it alter the price level? What do you think will happen to employment?
Chapter 24 Solutions
Principles of Economics 2e
Ch. 24 - Describe the mechanism by which supply creates its...Ch. 24 - Describe the mechanism by which demand creates its...Ch. 24 - The short run aggregate supply curve was...Ch. 24 - In the AD/AS model, what prevents the economy from...Ch. 24 - Suppose the U.S. Congress passes significant...Ch. 24 - Suppose concerns about the size of the federal...Ch. 24 - How would a dramatic increase in the value of the...Ch. 24 - Suppose Mexico, one of our largest trading...Ch. 24 - A policymaker claims that tax cuts led the economy...Ch. 24 - Many financial analysts and economists eagerly...
Ch. 24 - What impact would a decrease in the size of the...Ch. 24 - Suppose, after five years of sluggish growth, the...Ch. 24 - Suppose the Federal Reserve begins to Increase the...Ch. 24 - If the economy is operating in the neoclassical...Ch. 24 - If the economy is operating In the Keynesian zone...Ch. 24 - What is says law?Ch. 24 - What is Keynes; law?Ch. 24 - Do neoclassical economists believe in Keynes law...Ch. 24 - Does Says law apply more accurately in the long...Ch. 24 - What is on the horizontal axis of the AD/AS...Ch. 24 - What is the economic reason why the SRAS curve...Ch. 24 - What are the components of the aggregate demand...Ch. 24 - What are the economic reasons why the AD curve...Ch. 24 - Briefly explain the reason for the near-horizontal...Ch. 24 - Briefly explain the reason for the near-vertical...Ch. 24 - What is potential GDP?Ch. 24 - Name some factors that could cause the SRAS curve...Ch. 24 - Will the shift of SRAS to the right tend to make...Ch. 24 - What is stagflation?Ch. 24 - Name some factors that could cause AD to shift,...Ch. 24 - Would a shift of AD to the right tend to make the...Ch. 24 - How is long-term growth illustrated in an AD/AS...Ch. 24 - How is recession illustrated in an AD/AS model?Ch. 24 - How is cyclical unemployment illustrated in an...Ch. 24 - How is the natural rate of unemployment...Ch. 24 - How is pressure for inflationary price increases...Ch. 24 - What are some of the ways in which exports and...Ch. 24 - What is the Keynesian zone of the SRAS curve? How...Ch. 24 - What is the neoclassical zone of the SRAS curve?...Ch. 24 - What is the intermediate zone of the SRAS curve?...Ch. 24 - Why would an economist choose either the...Ch. 24 - On a microeconomic demand curve, a decrease in...Ch. 24 - Economists expect that as the labor market...Ch. 24 - If new government regulations require firms to use...Ch. 24 - During spring 2016 the Midwestern United States,...Ch. 24 - Hydraulic fracturing (tracking) has the potential...Ch. 24 - Some politicians have suggested tying the minimum...Ch. 24 - If households decide to save a larger portion of...Ch. 24 - If firms become more optimistic about the future...Ch. 24 - If Congress cuts taxes at the same time that...Ch. 24 - Suppose the level of structural unemployment...Ch. 24 - If foreign wealth-holders decide that the United...Ch. 24 - The AD/AS model is static. It shows a snapshot of...Ch. 24 - Explain why the short-run aggregate supply curve...Ch. 24 - Explain why the short-run aggregate supply curve...Ch. 24 - Why might it be important for policymakers to know...Ch. 24 - In your view, is the economy currently operating...Ch. 24 - Are Says law and Keynes law necessarily mutually...Ch. 24 - Review the problem in the Work It Out titled...Ch. 24 - The imaginary country of Harris Island has the...Ch. 24 - Table 24.4 describes Santhers economy. Plot the...
Additional Business Textbook Solutions
Find more solutions based on key concepts
Which of the following statements is false? A. The four dimensions of performance that are considered in a bala...
Principles of Accounting Volume 2
What are the four elements of the budgeting cycle?
Cost Accounting (15th Edition)
What is an internai change order and how is it used?
Construction Accounting And Financial Management (4th Edition)
Prepare a production cost report and journal entries (Learning Objectives 4 5) Vintage Accessories manufacture...
Managerial Accounting (5th Edition)
Direct, indirect, fixed, and variable costs. California Tires manufactures two types of tires that it sells as ...
Horngren's Cost Accounting: A Managerial Emphasis (16th Edition)
Ravenna Candles recently purchased candleholders for resale in its shops. Which of the following costs would be...
Financial Accounting (12th Edition) (What's New in Accounting)
Knowledge Booster

Similar questions
- Will the shift of SRAS to the right tend to make the equilibrium quantity and price level higher or lower? What about a shift of SRAS to the left?arrow_forwardUse the AD-AS model in the figure below to answer the following questions. Price level LRAS AS * AD, AD₂ AD₁ Real GDP Suppose this economy is operating at point B, if there is an increase in the price of inputs, then in the short and in the long run. . . . run a) real GDP falls and the price level rises; real GDP is below its original level with a higher price level b) real GDP rises and the price level falls; real GDP and the price level return to their original levels c) real GDP and the price level both rise; real GDP is above its original level with a higher price level d) real GDP falls and the price level rises; real GDP is at its original level as a result of the factor price adjustment process e) real GDP and the price level both rise; real GDP returns to its original level with a higher price levelarrow_forwardDepict in the AD-AS model, an economy exhibiting a short run equilibrium with a negative output gap resulting from a decline in AD caused by falling investment spending. What is true about the level of unemployment in this circumstance? What is true about the utilization of capital in this circumstance? What are the implications of your statements in parts a and b for long run adjustments in resource prices? How will these changes in resource prices impact the economy in the long run? Depict this change in your graph.arrow_forward
- Using an AD/AS diagram (starting from long-run/full employment equilibrium), graphically show and verbally describe how each of the following events would affect the U.S. economy's equilibrium real GDP and price level. a. Discovery and implementation of new technology b. Mexico's economic growth increases faster than ours c. There is a general increase in the price of raw materials e. The cost of labor (wages) rises g. The price of oil is expected to fall d. The number of workers in the labor force decreases due to pandemic retirements/death f. A new Congress decreases government spending h. Consumer confidence fallsarrow_forwardBeginning in March 2013, federal government spending was resstrained due to the sequester (feel free to Google details). Moreover, then President Obama’s budget proposals called for cuts in various types of government spending over the next ten years. Use the AD-AS model (along with a labor market graph) to show and explain how this will affect Y, N, W/P, and P over time. As an aside, recent news reports have suggested that the possibility of a renewed use of the sequester is part of the current political maneuvering over the federal budget for the fiscal year that starts October 1st.arrow_forwardUse the AD-AS model to explain the impact of a general increase in productivity on the general price level and the level of real production and income in the economyarrow_forward
- Review the problem shown in the Work It Out titled "Interpreting the AD/AS Model." Like the information provided in that feature, Table 24.2 shows information on aggregate supply, aggregate demand, and the price level for the imaginary country of Xurbia. Price Level AD AS 110 700 600 120 690 640 130 680 680 140 670 720 150 660 740 160 650 760 170 640 770 Table24.2 Price Level: AD/AS Plot the AD/AS diagram from the data shown. Identify the equilibrium. Imagine that, as a result of a government tax cut, aggregate demand becomes higher by 50 at every price level. Identify the new equilibrium. How will the new equilibrium alter output? How will it alter the price level? What do you think will happen to employment?arrow_forwardAssume there is a particular short-run aggregate supply curve for an economy and the curve is relevant for several years. Use the AD-AS analysis to show graphically why higher rates of inflflation over this period would be associated with lower rates of unemployment, and vice versa. What is this inverse relationship called?arrow_forwardExplain what will happen to an AD-AS diagram, if there is a decrease in input prices.arrow_forward
arrow_back_ios
SEE MORE QUESTIONS
arrow_forward_ios
Recommended textbooks for you
 Economics: Private and Public Choice (MindTap Cou...EconomicsISBN:9781305506725Author:James D. Gwartney, Richard L. Stroup, Russell S. Sobel, David A. MacphersonPublisher:Cengage Learning
 Macroeconomics: Private and Public Choice (MindTa...EconomicsISBN:9781305506756Author:James D. Gwartney, Richard L. Stroup, Russell S. Sobel, David A. MacphersonPublisher:Cengage Learning


Economics: Private and Public Choice (MindTap Cou...
Economics
ISBN:9781305506725
Author:James D. Gwartney, Richard L. Stroup, Russell S. Sobel, David A. Macpherson
Publisher:Cengage Learning
Macroeconomics: Private and Public Choice (MindTa...
Economics
ISBN:9781305506756
Author:James D. Gwartney, Richard L. Stroup, Russell S. Sobel, David A. Macpherson
Publisher:Cengage Learning