
Sub part (a):
The Gini ratio.
Sub part (a):
Explanation of Solution
Figure 1 illustrates the Lorenz curve.
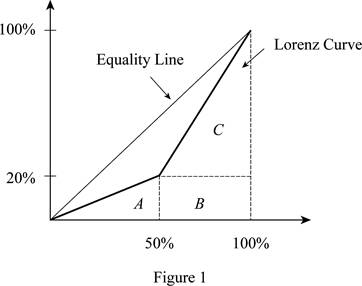
In Figure 1, the horizontal axis measures the percentage of population and the vertical axis measures the percentage of income. In this, we find the area under the Lorenz curve. Thus, the area of triangle can be calculated as follows:
Thus, the area of triangle is 500.
The base of the triangle is 50 (at 50%) because there are only two people in the economy. The height of the triangle is 20 (at 20%) because the lowest income is $20,000, which is 20% of the total income earned in society (= ($20,000 / $100,000) x 100).
The area of the rectangle of B can be calculated as follows:
Thus, the area of the rectangle B value is 1,000.
The area of the rectangle of C can be calculated as follows:
The area of triangle C is 2,000.
The total area under the Lorenz curve can be calculated as follows:
The total area value is 3,500.
The Gini ratio can be calculated as follows:
Thus, the Gini ratio is 0.300.
Concept introduction:
Gini ratio: It is a measure of statistical scattering that is intended to represent the income distribution of a nation's residents and is most commonly used to measure inequality.
Lorenz curve: It is the graphical illustration of the income distribution or of the wealth.
Sub Part (b):
The Gini ratio in the scenario 2.
Sub Part (b):
Explanation of Solution
After the tax and redistribution program Larry's new income is $40,000 and Roger's new income is $60,000. This implies that Larry (50% of the population) now controls 40% of the society's income rather than the 20% before the program.
The area of the triangle A can be calculated as follows:
The value of the triangle area is 1,000.
The value of rectangle B can be calculated as follows:
The area of rectangle B is 2,000.
The area of rectangle C can be calculated as follows:
The area of triangle C can be calculated as follows:
The total area under the Lorenz curve can be calculated as follows:
The total area value is 4,500.
The Gini ratio can be calculated as follows:
Thus the Gini ratio here is 0.100.
Concept introduction:
Gini ratio: It is a measure of statistical scattering that is intended to represent the income distribution of a nation's residents and is most commonly used to measure inequality.
Lorenz curve: It is the graphical illustration of the income distribution or of the wealth.
Sub part (c):
Change in the Gini ratio with change in income.
Sub part (c):
Explanation of Solution
If the income is double, Larry will earn $40,000 and Roger will earn $160,000. The total income in society is now $200,000. Larry still only controls 20% of the society's income ((=$40,000/$200,000) x 100).
Since the doubling of income does not change the percentage of income that is controlled by Larry (or Roger) , the Gini ratio will not change. Thus, the answer will be the same as in part 'a' at 0.300. Thus, the Gini ratio remains the same as it was before and after the income doubles.
Want to see more full solutions like this?

- %24 A household with income that is two-thirds of the poverty threshold has ratio of income to poverty of O 0.67. O 1.50. O 3.20. O0.23. Unit 7- Chapter 1..xlsx 0Unit 7- Chapter 1..xlsx Topic 2 (2).docx Topic 2 (1).docx 11:07 PM 73 F ENG 自 ins prt sc delete f12 pue LL3 114 SI unu backspace -> bock 7. 5. 55 enter () H. pause * shift ctrlarrow_forwardWhich would be evidence of an increase in income inequality over time in the United States? O a decrease in the percentage of total personal income received by the highest quintile O an increase in the percentage of total personal income received by the highest quintile O an increase in the percentage of total personal income received by the four lowest quintiles O an increase in the percentage of total personal income received by the lowest quintilearrow_forwardPROBLEMS 1. Workers are compensated by firms with “benefits” in addition to wages and salaries. The most prominent benefit offered by many firms is health insurance. Suppose that in 2000, workers at one steel plant were paid $20 per hour and in addition received health benefits at the rate of $4 per hour. Also suppose that by 2010 workers at that plant were paid $21 per hour but received $9 in health insurance benefits. LO17.1 By what percentage did total compensation (wages plus benefits) change at this plant from 2000 to 2010? What was the approximate average annual percentage change in total compensation? By what percentage did wages change at this plant from 2000 to 2010? What was the approximate average annual percentage change in wages? If workers value a dollar of health benefits as much as they value a dollar of wages, by what total percentage will they feel that their incomes have risen over this time period? What if they only consider wages when calculating their incomes?…arrow_forward
- Q7.1) The following question refers to income inequality and the Lorenz curve. Answer the question below: - Does it matter if some people are much richer than others?- Who are the top 1 percent in income and what are the effects of demography on socialinequality in various regions of the world today?- Why has income inequality worsened?- Does wealth distribution follow a similar pattern from generation to generation? What do experts say is the best way to shrink the wealth gap?arrow_forwardImagine an economy with only two people. Larry earns $20,000 per year, while Roger earns $80,000 per year. As shown in the following figure, the Lorenz curve for this twoperson economy consists of two line segments. The first runs from the origin to point a, while the second runs from point a to point b. a. Calculate the Gini ratio for this two-person economy using the geometric formulas for the area of a triangle (= ½ × base × height) and the area of a rectangle ( = base × height). (Hint: The area under the line segment from point a to point b can be thought of as the sum of the area of a particular triangle and the area of a particular rectangle.) b. What would the Gini ratio be if the government taxed $20,000 away from Roger and gave it to Larry? (Hint: The figure will change.) c. Start again with Larry earning $20,000 per year and Roger earning $80,000 per year. What would the Gini ratio be if both their incomes doubled? How much has the Gini ratio changed from before the doubling…arrow_forwardDo you agree or disagree? Explain your reasoning. “There need be no trade-off between equality and efficiency. An ‘efficient’ economy that yields an income distribution that many regard as unfair may cause those with meager incomes to become discouraged and stop trying. So efficiency may be undermined. A fairer distribution of rewards may generate a higher average productive effort on the part of the population, thereby enhancing efficiency. If people think they are playing a fair economic game and this belief causes them to try harder, an economy with an equitable income distribution may be efficient as well.arrow_forward
- 10 9 8 7 O) 6 LO 5 4 3 2 1 2 3 4 5 6 7 8 9 10 • Label axis variables • Label curves Highlight the market envelope • Draw the wage-safety locus • Add indifference curves for a different worker. Are they more or less risk-averse?arrow_forwardThe area between the Lorenz curve of a country and the diagonal of perfect equality represents: O A. the area of equality. ОВ. the area of inequality. C. The Gini coefficient. O D. The quantile ratio. O E. the cumulative percentage of the population.arrow_forwardThe figure below is the Lorenz curve of a population. Based on this figure, which of the following statements are correct? Cumulative share of land (%) Landowners' share of land 100- 30 ר 0 Perfect equality line 50 80 100 Cumulative share of the population from least to most land owned (%) O 50% of the population owns 20% of the land. 30% of the population owns 1% of the land each. O 20% of the population owns 2% of the land each. The bottom 80% own 70% of the landarrow_forward
- Labor demand and supply of labor is one of the external factors that impact compensation practices. If supply of labor is less than the labor demand, most employers offer to jobseekers. Higher rate Going rate Lower rate Market rate A clothing manufacturing utilizes Merrick's Multiple Piece Rate System that sets the standard output to 100 units per week and normal piece rate at 5 RO per unit. If Worker Z's actual weekly output is 100 units, solve earning per week. 650 О 500 O 550 O 600 ооо оarrow_forward"Growth and improvement in inequality are important to alleviate poverty.' а. Examine any FOUR (4) factors that can influence poverty eradication and income distribution in Malaysia. [12 marks] b. Describe any FOUR (4) factors that affect the income distribution in Malaysia.arrow_forwardAs income transfer programs accompanying the War on Poverty increased beginning in the latter half of the 1960s, what happened to poverty in the United States? Check all that apply. O The adjusted poverty rate has declined rapidly and is now less than half of the official poverty rate. O The poverty rate declined substantially in the period before the War on Poverty, but not in the period after the start of the War on Poverty. O In 2018, the adjusted poverty rate was only 4 percentage points lower than the official rate in 1970. O The War on Poverty has been largely ineffective in reducing the rate of poverty in the United States.arrow_forward

 Principles of Economics (12th Edition)EconomicsISBN:9780134078779Author:Karl E. Case, Ray C. Fair, Sharon E. OsterPublisher:PEARSON
 Engineering Economy (17th Edition)EconomicsISBN:9780134870069Author:William G. Sullivan, Elin M. Wicks, C. Patrick KoellingPublisher:PEARSON
 Principles of Economics (MindTap Course List)EconomicsISBN:9781305585126Author:N. Gregory MankiwPublisher:Cengage Learning
 Managerial Economics: A Problem Solving ApproachEconomicsISBN:9781337106665Author:Luke M. Froeb, Brian T. McCann, Michael R. Ward, Mike ShorPublisher:Cengage Learning
 Managerial Economics & Business Strategy (Mcgraw-...EconomicsISBN:9781259290619Author:Michael Baye, Jeff PrincePublisher:McGraw-Hill Education