
Concept explainers
Videos
Application Exercises
The bar graph shows minimum legal ages for sex and marriage in five selected countries. Use this information to solve Exercises 99–100. (We did not include data for the United States because the legal age of sexual consent varies according to state law. Furthermore, women are allowed to marry younger than men: 16 for women and 18 for men.)
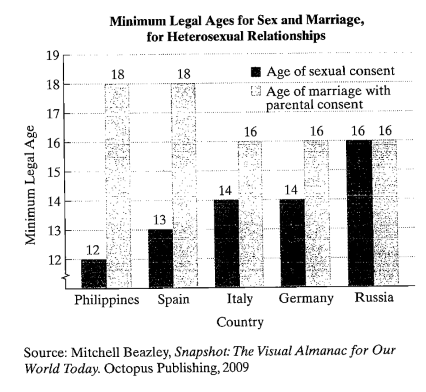
a. Write a set of five ordered pairs in which countries correspond to the minimum legal age of sexual consent. Each ordered pair should be in the form
(country, minimum legal age of sexual consent).
b. Is the relation in part (a) a function? Explain your answer.
c. Write a set of five ordered pairs in which the minimum legal age of sexual consent corresponds to a country. Each ordered pair should be in the form
(minimum legal age of sexual consent, country).
d. Is the relation in part (c) a function?
Want to see the full answer?
Check out a sample textbook solution
Chapter 2 Solutions
Algebra and Trigonometry


- Each month interviewers visit about 63,000 of the 84 million households in the region and question the occupants over 14 years of age about their immigration status. Their responses enable the interviewers to estimate the percentage of people in the labor force who are illegal immigrants. Complete parts a through c. a. Define the population of interest to the interviewers. A. The 63,000 households visited in the region B. Immigration status C. All people in the region who are over 14 years old D. The 84 million households in the regionarrow_forwardC. Describe the four characteristics of associationarrow_forwardplease show step by step ....thank you .arrow_forward
- In 2012 in the United States, most electricity was generated from coal (37%), natural gas (30%), or nuclear power plants (19%). Hydropower accounted for 7% of the total electricity produced; other renewable sources such as wind or solar power accounted for 5%. Other nonrenewable sources (such as petroleum) made up the remaining 2%. Complete parts a through d below. a. Display the information in a bar graph. The bars, from left to right, represent coal, natural gas, nuclear power, hydropower, wind or solar, and other nonrenewable sources. Choose the correct graph below. O B. O A. Q 40- 40- 30- 30- Q 20- 20- 10- 10- G 0- Electricity Source Electricity Source Q 40 40- Q Q 30- 30- 20- 20- 10- 10- 0- 0- Electricity Source Electricity Source b. Which is easier to sketch relatively accurately, a pie chart or a bar chart? O A. A bar chart is easier because the bars are always in decreasing order of category percentages, which makes comparisons of categories easier. OB. A pie chart is easier…arrow_forwardThe higher education department of Holmes Institute recorded data on the number of students enrolled in the different study majors for the years 2018 and 2019. Study major 2018 2019 Statistics 1700 2250 Business law 700 900 Accounting 1300 1450 Economics 750 1000 Finance 1450 1758 Marketing management 1069 1189 Auditing 360 351 Use an appropriate graphical technique or chart to compare the number of enrolment in 2018 and 2019 of the different study major. Display the chart. Use an appropriate graphical technique or chart to display the percentage value of the number of enrolment of the different study major in 2018 and 2019. Display the chart.arrow_forwardThe table below gives information for three different grocery purchases made by people in differentstates. Using the example as a guide, fill in the missing information in the table.arrow_forward
- The figure shows population density (people per square mile) for all states of a certain country. The states are divided into four geographical regions: A, B, C, and D. Answer the questions below. List the approximate median number of people per square mile for each location; for example, the median for Region A is approximately 110. The median for Region B is. The median for Region C is The median for Region D isarrow_forwardI need assistance with parts a, b, and c. Because of high tuition costs at state and private universities, enrollments at community colleges have increased dramatically in recent years. The following data show the enrollment (in thousands) for Jefferson Community College for the nine most recent years. Click on the datafile logo to reference the data. Year Period (t) Enrollment(1,000s) 2001 1 6.5 2002 2 8.1 2003 3 8.4 2004 4 10.2 2005 5 12.5 2006 6 13.3 2007 7 13.7 2008 8 17.2 2009 9 18.1 A. Choose the correct time series plot. What type of pattern exists in the data? Positive trend pattern or negative trend pattern B. Use simple linear regression analysis to find the parameters for the line that minimizes MSE for this time series. If required, round your answers to two decimal places. y-intercept, b0 = Slope, b1 = MSE= C. What is the forecast for year 10? Do not round your interim computations and round your final answer to two decimal places.arrow_forwardPrices and mileage of 30 Subaru Forester models within 50 miles of Columbus, Indiana are collected from Cargarus.com. Mileage ranged from 7,442 to 77,674 miles. Prices ranged from $25,560 to $29,990. Attached file.arrow_forward
- Andrea conducted a survey in which she collected data on the percentage of people who like horror films and the percentage of people who like romantic dramas. Which of the following could sufficiently display the data if only the two given categories are to be included? Select the correct answer below: pie chart bar graph neither a pie chart nor a bar graph either a pie chart or a bar grapharrow_forwarda. Plot a scatter diagram. b. If 60 is the minimum passing grade, below which placement test score should students in the future be denied admission to this course?arrow_forward1c. please use prior information.arrow_forward
 Glencoe Algebra 1, Student Edition, 9780079039897...AlgebraISBN:9780079039897Author:CarterPublisher:McGraw Hill
 Holt Mcdougal Larson Pre-algebra: Student Edition...AlgebraISBN:9780547587776Author:HOLT MCDOUGALPublisher:HOLT MCDOUGAL