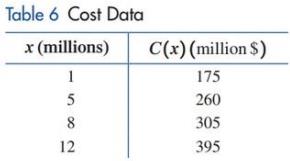
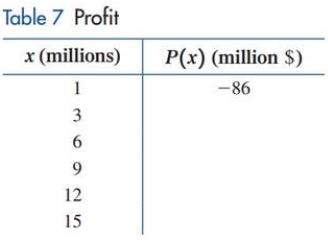
The financial department using statistical techniques, produced the data in Table, where C x is the cost in millions of dollars for manufacturing and selling x million cameras. Table Cost Data Using special analytical techniques (regression analysis), an analyst produced the following cost function to model the Table 6 data: C x = 156 + 19.7 x 1 < x < 15 …… (5) (a) Plot the data in Table 6 . Then sketch a graph of equation (5) in the same coordinate system . (b) Using the revenue function from Example 7(B), what is the company’s profit function for this camera, and what is its domain? (c) Complete Table 7 , computing profits to the nearest million dollars. (d) Plot the data in Table 7 . Then sketch a graph of the profit function using these points. (e) Graph the profit function on a graphing calculator.
The financial department using statistical techniques, produced the data in Table, where C x is the cost in millions of dollars for manufacturing and selling x million cameras. Table Cost Data Using special analytical techniques (regression analysis), an analyst produced the following cost function to model the Table 6 data: C x = 156 + 19.7 x 1 < x < 15 …… (5) (a) Plot the data in Table 6 . Then sketch a graph of equation (5) in the same coordinate system . (b) Using the revenue function from Example 7(B), what is the company’s profit function for this camera, and what is its domain? (c) Complete Table 7 , computing profits to the nearest million dollars. (d) Plot the data in Table 7 . Then sketch a graph of the profit function using these points. (e) Graph the profit function on a graphing calculator.
The financial department using statistical techniques, produced the data in Table, where
C
x
is the cost in millions of dollars for manufacturing and selling
x
million cameras.
Table Cost Data
Using special analytical techniques (regression analysis), an analyst produced the following cost function to model the Table
6
data:
C
x
=
156
+
19.7
x
1
<
x
<
15
…… (5)
(a) Plot the data in Table
6
. Then sketch a graph of equation (5) in the same coordinate system.
(b) Using the revenue function from Example 7(B), what is the company’s profit function for this camera, and what is its domain?
(c) Complete Table
7
, computing profits to the nearest million dollars.
(d) Plot the data in Table
7
. Then sketch a graph of the profit function using these points.
(e) Graph the profit function on a graphing calculator.
System that uses coordinates to uniquely determine the position of points. The most common coordinate system is the Cartesian system, where points are given by distance along a horizontal x-axis and vertical y-axis from the origin. A polar coordinate system locates a point by its direction relative to a reference direction and its distance from a given point. In three dimensions, it leads to cylindrical and spherical coordinates.
Using & Understanding Mathematics: A Quantitative Reasoning Approach (7th Edition)
Knowledge Booster
Learn more about
Need a deep-dive on the concept behind this application? Look no further. Learn more about this topic, subject and related others by exploring similar questions and additional content below.
Correlation Vs Regression: Difference Between them with definition & Comparison Chart; Author: Key Differences;https://www.youtube.com/watch?v=Ou2QGSJVd0U;License: Standard YouTube License, CC-BY
Correlation and Regression: Concepts with Illustrative examples; Author: LEARN & APPLY : Lean and Six Sigma;https://www.youtube.com/watch?v=xTpHD5WLuoA;License: Standard YouTube License, CC-BY


 College AlgebraAlgebraISBN:9781305115545Author:James Stewart, Lothar Redlin, Saleem WatsonPublisher:Cengage Learning
 Algebra and Trigonometry (MindTap Course List)AlgebraISBN:9781305071742Author:James Stewart, Lothar Redlin, Saleem WatsonPublisher:Cengage Learning
 Algebra & Trigonometry with Analytic GeometryAlgebraISBN:9781133382119Author:SwokowskiPublisher:Cengage
 Glencoe Algebra 1, Student Edition, 9780079039897...AlgebraISBN:9780079039897Author:CarterPublisher:McGraw Hill