
Concept explainers
Videos
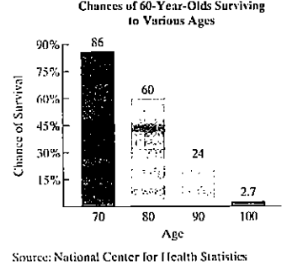
The bar graph shows your chances of surviving to various ages once you reach 60.
The functions
model the chance, as a percent, that a 60-year-old will survive to age x. Use this information to solve Exercises 101-102.
a. Find and interpret f (70).
b. Find and interpret g (70).
c Which function servers as a better model for the chance of surviving to age 70?
Want to see the full answer?
Check out a sample textbook solution
Chapter 2 Solutions
Algebra and Trigonometry (6th Edition)


- The bar graph shows your chances of surviving to various agesonce you reach 60.The functions f(x) = -2.9x + 286 and g(x) = 0.01x2 - 4.9x + 370 model the chance, as a percent, that a 60-year-old will survive to age x. a. Find and interpret f(70). b. Find and interpret g(70). c. Which function serves as a better model for the chance of surviving to age 70?arrow_forwardAn antique table increases in value according to the function v(x)=550(1.05)x dollars, where x is the number of years after1980 . a. How much was the table worth in 1980 ? b. If the pattern indicated by the function remains valid, what was the value of the table in 1995 ? c. Use a table or a graph to estimate the year when this table will reach double its 1980 value.arrow_forwardPhysicists using the radioactivity equation y = yo e - kt call the number 1 the mean life of a radioactive nucleus. Show that 95% of the radioactive nuclei originally present in a sample will disintegrate within three mean lifetimes, i.e., by time t=. Thus, the mean life of a k nucleus gives a quick way to estimate how long the radioactivity of a sample will last. ..... - kt If 95% of a sample has decayed, there is 5% remaining. How can you use the radioactivity equation y(t) = yo e to find when 5% of the sample is remaining? A. Set y(t) equal to 0.05 and solve for t. B. Evaluate y(0.05). C. Set y(t) equal to 0.05y, and solve for t. D. Evaluate y(5). Perform the operation determined in the previous step. Yo e - kt 0.05yo - kt e = 0.05 Divide both sides by yo: = In 0.05 Take the natural logarithm of each side. In 0.05 t = Solve for t. Approximate In 0.05. In 0.05 x (Round to three decimal places as needed.) Since this value is approximately equal to then 95% of a sample will…arrow_forward
- The function G(x)= −0.01x² +x+66 models the wage gap, as a percent, x years after 1980 in Country A. The graph of function G is shown underneath the actual data. a. Find and interpret G(30). Identify this information as a point on the graph of the function. G(30); in the year % of (Type whole numbers.) in country A. earnings were AMEK Median Women's Eamnings as a Percentage of Median Men's Earnings in Country A 89% Wage Gap (percent) Wage Gap (percent) 95 90- 85 80 75 RTTEESST 70- 65% 65 60 55 90 85- 80- 822 65- 60- 288 55- 50- 0 1980 1990 81% 2000 The Graph of a Function Modeling the Data G(x) = -0.01x² +x+66 2010 10 15 20 25 30 Years after 1980 Ⓒ Qarrow_forwardThe percentage of full-time instructors at colleges and universities in some country can be modeled by the equation y=−0.037x2−0.066x+59.843,where x is the number of years since 1990. a. Use the model to estimate the percentage of full time instructors in the year 2029. According to the model, ____% of instructors will be full-time instructors in 2029.arrow_forwardThe function G(x) = -0.01x +x+66 models the wage gap, as a percent, x years after 1980 in Country A. The graph of function G is shown underneath the actual data. a. Find and interpret G(30). Identify this information as a point on the graph of the function. G(30) = 87; in the year 2010, women's earnings were 87% of men's in country A (Type whole numbers.) Using the value of G(30), a point on the graph of the function is (30,87) (Type an ordered pair.) b. Does G(30) overestimate or underestimate the actual data shown by the bar graph? By how much? Select the correct choice below and fill in the answer box within your choice. G(30) (Type a whole number.) the actual data shown by% 1-2-00 Median Women's Earnings as a Percentage of Median Men's Earnings in Country A 89% Wage Gap (percent) (quepied) dop COOM 18868EGOVLFT hehenenehen 95 90 85 180 70- 65 60 90 85- 80- 75- 70- 65 60- 55- 50- 0 509 65% FORIE NO81% 1980 1990 2000 2010 The Graph of a Function Modeling the Data G(x) = -0.01x +x+66…arrow_forward
- Determine whether the function is increasing or decreasing. b (x) =1 – 3x %3D (a) The function is increasing. (b) The function is decreasing. In a few sentences, please explain how you arrived at your answer.arrow_forwardThe bar graph shows the wage gap for selected years from 1980 through 2010.The function G(x) = -0.01x2 + x + 60 models the wage gap, as a percent, x years after 1980. . a. Find and interpret G(30). Identify this information as a point on the graph of the function.b. Does G(30) overestimate or underestimate the actual data shown by the bar graph? By how much?arrow_forwardAarav has 3,250 followers on social media. His number of followers is increasing at a rate of 3% per week. Which function represents his number of followers each week? A. f(w) = 3,250(3)w B. f(w) = 3,250(1.03)w C. f(w) = 3,250(0.03)w D. f(w) = 3,250(0.97)warrow_forward
- The bar graph shows the percentage of country A high school seniors who applied to more than three colleges for selected years from 1980 through 2013. The data in the bar graph can be modeled by f(x) = x + 24 and 0.0216x g(x) = 30.6 e in which f(x) and g(x) represent the percentage of high school seniors who applied to more than three colleges x years after 1980. Use these functions to complete parts (a) through (c) below. a. According to the linear model, what percentage of high school seniors applied to more than three colleges in 2005? % b. According to the exponential model, what percentage of high school seniors applied to more than three colleges in 2005? Percentage of country A High School Seniors Applying to More Than Three Colleges Percentage of high school seniors 80- 60- 40 30 20- 51 44 40 56 63 71 1980 1990 1995 2000 2005 2010 2013 Yeararrow_forwardResearch suggests that the probability of a certain fuse malfunctioning increases exponentially as the concentration of an impurity in the fuse increases. The probability is modeled by the function y=5(257996)x, where x is the impurity concentration, and y, given as a percent, is the probability of the fuse malfunctioning. Find the probability of the fuse malfunctioning for an impurity concentration of 0.19. Round to the nearest percent.arrow_forwardThe number of hours of video uploaded to YouTube per minute is shown in the table below. Year # of hours of video uploaded per minute 2007 6 2008 10 2009 20 2010 24 2011 48 2012 60 2013 100 Let y be the video upload rate at x years since 2005. Construct a scatterplot by hand. Is the relationship linear or exponential? Increasing or decreasing? Write an equation modeling the number of hours of video uploaded per minute if the initial number of hours is 2.6 and it increases by 59%. Use your equation to find the number of hours uploaded in 2015.arrow_forward
 Glencoe Algebra 1, Student Edition, 9780079039897...AlgebraISBN:9780079039897Author:CarterPublisher:McGraw Hill
 Algebra: Structure And Method, Book 1AlgebraISBN:9780395977224Author:Richard G. Brown, Mary P. Dolciani, Robert H. Sorgenfrey, William L. ColePublisher:McDougal Littell
 Big Ideas Math A Bridge To Success Algebra 1: Stu...AlgebraISBN:9781680331141Author:HOUGHTON MIFFLIN HARCOURTPublisher:Houghton Mifflin Harcourt