The Physics of Everyday Phenomena
8th Edition
ISBN: 9780073513904
Author: W. Thomas Griffith, Juliet Brosing Professor
Publisher: McGraw-Hill Education
expand_more
expand_more
format_list_bulleted
Concept explainers
Videos
Textbook Question
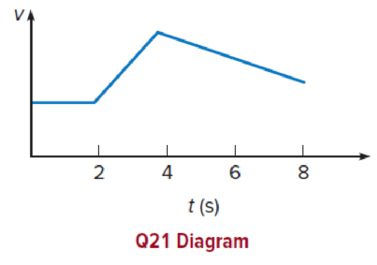
Chapter 2, Problem 21CQ
In the graph shown here, velocity is plotted as a function of time for an object traveling in a straight line.
- a. Is the velocity constant for any time interval shown? Explain.
- b. During which time interval shown does the object have the greatest acceleration? Explain.
Expert Solution & Answer
Want to see the full answer?
Check out a sample textbook solution
Students have asked these similar questions
a.) Draw the distance vs. time graph. Find the slope. b.) Describe the graph line. What does it imply?
a.) Draw the speed vs. time graph. Find the slope. Describe the graph line. What does it imply? b.) Find the slope of the graph and compare it with the calculated acceleration.
Describe the motion of a freely falling body based on the results obtained.
If, by some suitable mechanism, the falling body had been given an initial downward push instead of being just released, would the resulting value of `g’ have been different? Explain.
Problems:
An object is dropped from rest at a height of 300 m.a. Find the velocity after 2 seconds.b. Find the time it takes for the object to reach the ground. c. With what velocity does it hit the ground?
A car starting from rest is accelerated 15 m/s2. In how many seconds will its velocity be equal to 100 m/s? How far will it have traveled during this same time?
Consider the graph provided.
a. With the use of an example, describe the motion graph.
b. Make a sketch of the corresponding velocity time graph. Be sure to label times
and axes.
10
0.
-10
-20
40
10
20
30
Time elapsed, t (minutes)
Position, d (m) M, of school
20
Does a real automobile have constant acceleration? Measured data for aPorsche 944 Turbo at maximum acceleration are as shown in the table.a. Convert the velocities to m/s, then make a graph of velocity versus time.Based on your graph, is the acceleration constant? Explain.b. Estimate how far the car traveled in the first 10 s.c. Draw a smooth curve through the points on your graph, then use your graph to estimate the car’s acceleration at 2.0 s and 8.0 s. Give your answer in SI units. Hint: Remember that acceleration is the slope of the velocity graph.
Chapter 2 Solutions
The Physics of Everyday Phenomena
Ch. 2 - Prob. 1CQCh. 2 - Suppose we choose inches as our basic unit of...Ch. 2 - What units would have an appropriate size for...Ch. 2 - A tortoise and a hare cover the same distance in a...Ch. 2 - A driver states that she was doing 80 when stopped...Ch. 2 - Does the speedometer on a car measure average...Ch. 2 - Is the average speed over several minutes more...Ch. 2 - The highway patrol sometimes uses radar guns to...Ch. 2 - Is the term vehicle density (as used in everyday...Ch. 2 - Prob. 10CQ
Ch. 2 - At the front end of a traffic jam, is the vehicle...Ch. 2 - A hockey puck is sliding on frictionless ice. It...Ch. 2 - A ball attached to a string is whirled in a...Ch. 2 - Prob. 14CQCh. 2 - A dropped ball gains speed as it falls. Can the...Ch. 2 - A driver of a car steps on the brakes, causing the...Ch. 2 - At a given instant in time, two cars are traveling...Ch. 2 - A car just starting up from a stop sign has zero...Ch. 2 - A car traveling with constant speed rounds a curve...Ch. 2 - A racing sports car traveling with a constant...Ch. 2 - In the graph shown here, velocity is plotted as a...Ch. 2 - A car moves along a straight line so that its...Ch. 2 - For the car whose distance is plotted against time...Ch. 2 - A car moves along a straight section of road so...Ch. 2 - For the car whose velocity is plotted in question...Ch. 2 - Look again at the velocity-versus-time graph for...Ch. 2 - Suppose the acceleration of a car increases with...Ch. 2 - When a car accelerates uniformly from rest, which...Ch. 2 - The velocity-versus-time graph of an object curves...Ch. 2 - For a uniformly accelerated car, is the average...Ch. 2 - A car traveling in the forward direction...Ch. 2 - A car starts from rest, accelerates uniformly for...Ch. 2 - Suppose that two runners run a 100-meter dash, but...Ch. 2 - Sketch a graph showing velocity-versus-time curves...Ch. 2 - A physics instructor walks with increasing speed...Ch. 2 - Prob. 36CQCh. 2 - Return to example box 2.4, but this time assume...Ch. 2 - Prob. 1ECh. 2 - Prob. 2ECh. 2 - Prob. 3ECh. 2 - Prob. 4ECh. 2 - Prob. 5ECh. 2 - Prob. 6ECh. 2 - Prob. 7ECh. 2 - Prob. 8ECh. 2 - Prob. 9ECh. 2 - Prob. 10ECh. 2 - Prob. 11ECh. 2 - Prob. 12ECh. 2 - Prob. 13ECh. 2 - Prob. 14ECh. 2 - Prob. 15ECh. 2 - Prob. 16ECh. 2 - Prob. 17ECh. 2 - Prob. 18ECh. 2 - Prob. 1SPCh. 2 - Prob. 2SPCh. 2 - Prob. 3SPCh. 2 - Prob. 4SPCh. 2 - Prob. 5SP
Knowledge Booster


Learn more about
Need a deep-dive on the concept behind this application? Look no further. Learn more about this topic, physics and related others by exploring similar questions and additional content below.Similar questions
- (a) Sketch a graph of velocity versus time corresponding to the graph of displacement versus time given in the following figure. (b) Identify the time or times (ta,tb,tcetc.) at which the instantaneous velocity has the greatest positive value. (c) At which times is it zero? (d) At which times is it negative?arrow_forwardA student drives a moped along a straight road as described by the velocity-versus-time graph in Figure P2.12. Sketch this graph in the middle of a sheet of graph paper. (a) Directly above your graph, sketch a graph of the position versus time, aligning the time coordinates of the two graphs. (b) Sketch a graph of the acceleration versus time directly below the velocity-versus-time graph, again aligning the time coordinates. On each graph, show the numerical values of x and ax for all points of inflection. (c) What is the acceleration at t = 6.00 s? (d) Find the position (relative to the starting point) at t = 6.00 s. (e) What is the mopeds final position at t = 9.00 s? Figure P2.12arrow_forwardA cyclist rides 8.0 km east for 20 minutes, then he turns and heads west for 8 minutes and 3.2 km. Finally, he rides east for 16 km, which takes 40 minutes. (a) What is the final displacement of the cyclist? (b) What is his average velocity?arrow_forward
- An object that moves in one dimension has the velocity-versus-time graph shown in Figure P2.52. At time t = 0, the object has position x = 0. a. At time t = 5 s. is the acceleration of the object positive, negative, or zero? Explain. b. At time t = 8 s, is the object speeding up, showing down, or moving with constant speed? Explain. c. Write an expression for the position of the object as a function of time. Explain how you use the graph to obtain your answer. d. Use your expression from part (c) to determine the time (if any) at which the object reaches its maximum position. Check your results by examining the graph. Hint: To get started with finding the maximum of a function, take the derivative and set it equal to zero.arrow_forwardMichael, a Grab driver receives a booking from his mobile phone and goes out of the highway to pick up his customer. He is driving his car at 25.0 m/s. The car accelerates at 2.0 m/s2 for 5 seconds and then maintains a constant velocity for 10.0 more seconds. a. Illustrate the 15 seconds of car's motion by making a velocity-time graph. Use the GRAPH to identify the distance that car traveled during the entire 15 seconds. b. Separate the motion into its two segments and use kinematic EQUATIONS to calculate the total distance traveled during the entire 15 seconds.arrow_forwardA honda civic starts moving from rest with constant acceleration of 4 m/s^2 for 5 seconds. a. Is it going to cover equal disteances every second during those 5 seconds? b. How much distance would the car cover in those five seconds of motion? show calculations c. What would be the instantaneous velocity of the car after five seconds of motion?arrow_forward
- V 0 A C. B 2. Two identical objects, A and B, move along straight, parallel, horizontal tracks. The graph above represents the velocity as a function of time for the two objects. a. At approximately which time or times, if any, are the objects moving at the same speed? If the objects are never moving with the same speed during the interval shown, indicate this explicitly. Briefly explain your answer. b. At approximately which time or times, if any, are the objects moving with the same acceleration? If the objects are never moving with the same acceleration during the interval shown, indicate this explicitly. Briefly explain your answer. At approximately which time intervals is object B moving at a greater speed than A? If the object B are never moving with the same speed during the interval shown, indicate this explicitly. Briefly explain your answer. d. If Object B has an initial position of Xb = -4.5m and Object A started at the origin, at approximately which time or times, if any,…arrow_forwardA particle’s velocity is shown in the graph below. At t = 0, its displacement is x = 0.a. Sketch the acceleration vs. time graph corresponding to this velocity vs. time graph.b. Sketch the graph of position (x) vs. time (t) corresponding to the velocity vs. time graph.c. Determine the average acceleration between t = 0 and 20 seconds.arrow_forwardSatellite data taken several times per hour on a particular albatross showed travel of 1200 km over a time of 1.4 days.a. Given these data, what was the bird’s average speed in mph?b. Data on the bird’s position were recorded only intermittently.Explain how this means that the bird’s actual average speed was higher than what you calculated in part a.arrow_forward
- Suppose the velocity of a car at any time is given by the equation v=60m/s + (0.50m/s³)t². Show your step by step solution. A.) Derive the expression for the instantaneous acceleration at any given time. B.) Use the derived equation to find the instantaneous acceleration at t=3sarrow_forwardAn object moves in one dimension, and its velocity versus time is shown in the graph. Express your answers in m/s2. A. What is the average acceleration between the times 0 s and 20 s? B. What is the average acceleration between the times 20 s and 50 s? C. What is the average acceleration between the times 50 s and 70 s? D. What is the average acceleration between the times 0 s and 100 s?arrow_forwardAn object moves in one dimension, according to the position versus time graph. Express your answers in m/s. A. What is the average velocity between the times 0 s and 0.4 s? B. What is the average velocity between the times 0.4 s and 1 s? C. What is the average velocity between the times 0.6 s and 1.6 s? D. What is the average velocity between the times 0 s and 2 s?arrow_forward
arrow_back_ios
SEE MORE QUESTIONS
arrow_forward_ios
Recommended textbooks for you
 Glencoe Physics: Principles and Problems, Student...PhysicsISBN:9780078807213Author:Paul W. ZitzewitzPublisher:Glencoe/McGraw-Hill
 University Physics Volume 1PhysicsISBN:9781938168277Author:William Moebs, Samuel J. Ling, Jeff SannyPublisher:OpenStax - Rice University
 Physics for Scientists and Engineers: Foundations...PhysicsISBN:9781133939146Author:Katz, Debora M.Publisher:Cengage Learning
 Principles of Physics: A Calculus-Based TextPhysicsISBN:9781133104261Author:Raymond A. Serway, John W. JewettPublisher:Cengage Learning
 Physics for Scientists and Engineers with Modern ...PhysicsISBN:9781337553292Author:Raymond A. Serway, John W. JewettPublisher:Cengage Learning
Glencoe Physics: Principles and Problems, Student...
Physics
ISBN:9780078807213
Author:Paul W. Zitzewitz
Publisher:Glencoe/McGraw-Hill
University Physics Volume 1
Physics
ISBN:9781938168277
Author:William Moebs, Samuel J. Ling, Jeff Sanny
Publisher:OpenStax - Rice University
Physics for Scientists and Engineers: Foundations...
Physics
ISBN:9781133939146
Author:Katz, Debora M.
Publisher:Cengage Learning
Principles of Physics: A Calculus-Based Text
Physics
ISBN:9781133104261
Author:Raymond A. Serway, John W. Jewett
Publisher:Cengage Learning
Physics for Scientists and Engineers with Modern ...
Physics
ISBN:9781337553292
Author:Raymond A. Serway, John W. Jewett
Publisher:Cengage Learning
Position/Velocity/Acceleration Part 1: Definitions; Author: Professor Dave explains;https://www.youtube.com/watch?v=4dCrkp8qgLU;License: Standard YouTube License, CC-BY