
Statistics: The Art and Science of Learning from Data (4th Edition)
4th Edition
ISBN: 9780321997838
Author: Alan Agresti, Christine A. Franklin, Bernhard Klingenberg
Publisher: PEARSON
expand_more
expand_more
format_list_bulleted
Videos
Textbook Question
Chapter 2, Problem 129CP
Controlling asthma A study of 13 children suffering from asthma (Clinical and Experimental Allergy, vol. 20, pp. 429–432, 1990) compared single inhaled doses of formoterol (F) and salbutamol (S). Each child was evaluated using both medications. The outcome measured was the child’s peak expiratory flow (PEF) eight hours following treament. Is there a difference in the PEF level for the two medications? The data on PEF follow:
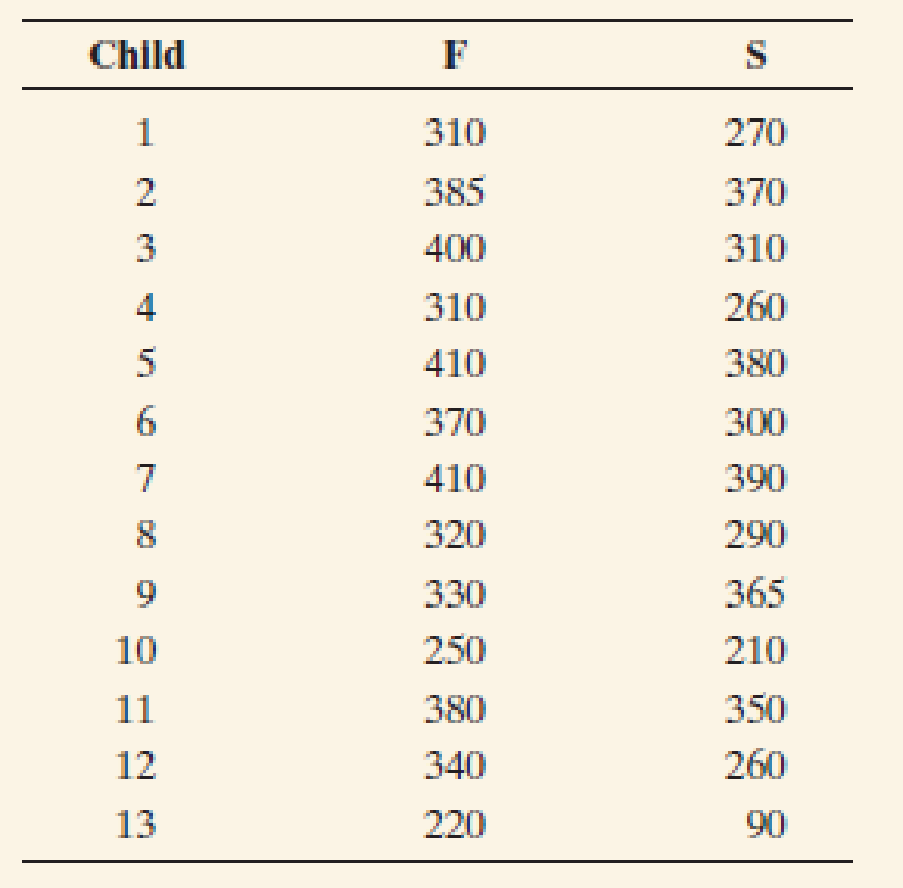
- a. Construct plots to compare formoterol and salbutamol. Write a short summary comparing the two distributions of the peak expiratory flow.
- b. Consider the distribution of differences between the PEF levels of the two medications. Find the 13 differences and construct and interpret a plot of the differences. If on the average there is no difference between the PEF level for the two brands, where would you expect the differences to be centered?
Expert Solution & Answer
Want to see the full answer?
Check out a sample textbook solution
Students have asked these similar questions
Hoaglin, Mosteller, and Tukey (1983) presented data on blood levels of beta-endorphin as a function of stress. They took beta-endorphin levels for 19 patients 12 hours before surgery and again 10 minutes before surgery. The data are presented below, in fmol/ml
Based on these data, what effect does increased stressed have on endorphin levels. What type of test is this?
Participant 12 hours before 10 minutes before
1 10 6.5
2 6.5 14.0
3 8.0 13.5
4 12 18
5 5.0 14.5
6 11.5 9.0
7 5.0 18.0
8 3.5…
Empty Stomachs. In the publication “How Often Do Fishes ‘Run on Empty’?” (Ecology, Vol. 83, No 8, pp. 2145–2151), D. Arrington et al. examined almost 37,000 fish of 254 species from the waters of Africa, South and Central America, and North America to determine the percentage of fish with empty stomachs. The fish were classified as piscivores (fish-eating), invertivores (invertibrateeating), omnivores (anything-eating) and algivores/detritivores (eating algae and other organic matter). For those fish in African waters, the data on theWeissStats site give the proportions of each species of fish with empty stomachs. At the 1% significance level, do the data provide sufficient evidence to conclude that a difference exists in the mean percentages of fish with empty stomachs among the four different types of feeders?
a. conduct a one-way ANOVA test on the data.
b. interpret your results from part (a).
c. decide whether presuming that the assumptions of normal populations and equal…
The Lion’sMane. In a study by P. M.West titled “The Lion’s Mane” (American Scientist, Vol. 93, No. 3, pp. 226–236), the effects of the mane of a male lion as a signal of quality to mates and rivals was explored. Four life-sized dummies of male lions provided a tool for testing female response to the unfamiliar lions whose manes varied by length (long or short) and color (blonde or dark). The female lions were observed to see whether they approached each of the four life-sized dummies.
a. experimental units.
b. response variable.
c. factor(s).
d. levels of each factor.
e. treatments.
Chapter 2 Solutions
Statistics: The Art and Science of Learning from Data (4th Edition)
Ch. 2.1 - Categorical/quantitative difference a. Explain the...Ch. 2.1 - U.S. married-couple households According to a...Ch. 2.1 - Identify the variable type Identify each of the...Ch. 2.1 - Categorical or quantitative? Identify each of the...Ch. 2.1 - Discrete/continuous a. Explain the difference...Ch. 2.1 - Discrete or continuous? Identify each of the...Ch. 2.1 - Discrete or continuous 2 Repeat the previous...Ch. 2.1 - Prob. 8PBCh. 2.1 - Fatal Shark Attacks Few of the shark attacks...Ch. 2.2 - Generating Electricity In 2012 in the United...
Ch. 2.2 - What do alligators eat? The bar chart is from a...Ch. 2.2 - Prob. 12PBCh. 2.2 - Prob. 13PBCh. 2.2 - Prob. 14PBCh. 2.2 - Sugar dot plot For the breakfast cereal data given...Ch. 2.2 - Prob. 16PBCh. 2.2 - Graphing exam scores A teacher shows her class the...Ch. 2.2 - Fertility rates The fertility rate for a nation is...Ch. 2.2 - Split Stems The figure below shows the...Ch. 2.2 - Histogram for sugar For the breakfast cereal data,...Ch. 2.2 - Prob. 21PBCh. 2.2 - Prob. 22PBCh. 2.2 - Prob. 23PBCh. 2.2 - Prob. 24PBCh. 2.2 - Prob. 25PBCh. 2.2 - Prob. 26PBCh. 2.2 - Prob. 27PBCh. 2.2 - Warming in Newnan, Georgia? Access the Newnan, GA...Ch. 2.3 - Median versus mean For each of the following...Ch. 2.3 - Prob. 30PBCh. 2.3 - Prob. 31PBCh. 2.3 - Resistance to an outlier Consider the following...Ch. 2.3 - Income and health insurance According to the U.S....Ch. 2.3 - Prob. 34PBCh. 2.3 - Prob. 35PBCh. 2.3 - Prob. 36PBCh. 2.3 - Public transportationcenter The owner of a company...Ch. 2.3 - Prob. 38PBCh. 2.3 - Prob. 39PBCh. 2.3 - European fertility The European fertility rates...Ch. 2.3 - Sex partners A recent General Social Survey asked...Ch. 2.3 - Prob. 43PBCh. 2.3 - Prob. 44PBCh. 2.3 - Prob. 45PBCh. 2.4 - Sick leave A company decides to investigate the...Ch. 2.4 - Prob. 47PBCh. 2.4 - Prob. 48PBCh. 2.4 - Prob. 49PBCh. 2.4 - Exam standard deviation For an exam given to a...Ch. 2.4 - Heights For the sample heights of Georgia college...Ch. 2.4 - Histograms and standard deviation The figure shows...Ch. 2.4 - Female strength The High School Female Athletes...Ch. 2.4 - Female body weight The College Athletes data file...Ch. 2.4 - Shape of cigarette taxes A recent summary for the...Ch. 2.4 - Empirical rule and skewed, highly discrete...Ch. 2.4 - How much TV? The 2012 General Social Survey asked,...Ch. 2.4 - How many friends? A recent General Social Survey...Ch. 2.4 - Judging skew using x and s If the largest...Ch. 2.4 - Youth unemployment in the EU The Youth...Ch. 2.4 - Create data with a given standard deviation Use...Ch. 2.5 - Vacation days National Geographic Traveler...Ch. 2.5 - Youth unemployment In recent years, many European...Ch. 2.5 - Female strength The High School Female Athletes...Ch. 2.5 - Female body weight The College Athletes data file...Ch. 2.5 - Ways to measure variability The standard...Ch. 2.5 - Variability of cigarette taxes Heres the...Ch. 2.5 - Prob. 68PBCh. 2.5 - Infant mortality Africa The Human Development...Ch. 2.5 - Prob. 70PBCh. 2.5 - Computer use During a recent semester at the...Ch. 2.5 - Central Park temperature distribution revisited...Ch. 2.5 - Box plot for exam The scores on an exam have mean...Ch. 2.5 - Public transportation Exercise 2.37 described a...Ch. 2.5 - Prob. 75PBCh. 2.5 - Prob. 76PBCh. 2.5 - Prob. 77PBCh. 2.5 - Prob. 78PBCh. 2.5 - Prob. 79PBCh. 2.5 - Prob. 80PBCh. 2.5 - Prob. 81PBCh. 2.5 - Prob. 82PBCh. 2.6 - Great pay (on the average) The six full-time...Ch. 2.6 - Prob. 84PBCh. 2.6 - Prob. 85PBCh. 2.6 - Terrorism and war in Iraq In 2004, a college...Ch. 2.6 - Prob. 87PBCh. 2.6 - Prob. 88PBCh. 2 - Categorical or quantitative? Identify each of the...Ch. 2 - Continuous or discrete? Which of the following...Ch. 2 - Prob. 92CPCh. 2 - Cool in China A recent survey8 asked 1200...Ch. 2 - Prob. 94CPCh. 2 - Prob. 95CPCh. 2 - Prob. 96CPCh. 2 - Prob. 97CPCh. 2 - Prob. 98CPCh. 2 - Prob. 99CPCh. 2 - Prob. 100CPCh. 2 - Prob. 101CPCh. 2 - Prob. 103CPCh. 2 - Household net worth A study reported that in 2007...Ch. 2 - Prob. 105CPCh. 2 - Prob. 106CPCh. 2 - Prob. 107CPCh. 2 - Central Park monthly temperatures The MINITAB...Ch. 2 - Prob. 109CPCh. 2 - Female heights According to a recent report from...Ch. 2 - Energy and water consumption In parts a and b,...Ch. 2 - Prob. 112CPCh. 2 - More hurricane damage Refer to the previous...Ch. 2 - Prob. 114CPCh. 2 - Prob. 115CPCh. 2 - Prob. 116CPCh. 2 - Prob. 117CPCh. 2 - Temperatures in Central Park Access the Central...Ch. 2 - Teachers salaries According to Statistical...Ch. 2 - Prob. 120CPCh. 2 - What box plot do you expect? For each of the...Ch. 2 - Prob. 122CPCh. 2 - Prob. 123CPCh. 2 - Prob. 124CPCh. 2 - Prob. 125CPCh. 2 - Who was Roger Maris? Roger Maris, who spent most...Ch. 2 - Baseballs great home run hitters The Baseballs HR...Ch. 2 - Prob. 128CPCh. 2 - Controlling asthma A study of 13 children...Ch. 2 - Prob. 130CPCh. 2 - Youth unemployment by gender The side-by-side box...Ch. 2 - You give examples Give an example of a variable...Ch. 2 - Political conservatism and liberalism Where do...Ch. 2 - Mode but not median and mean The previous exercise...Ch. 2 - Multiple choice: GRE scores In a study of graduate...Ch. 2 - Multiple choice: Fact about s Which statement...Ch. 2 - Prob. 137CPCh. 2 - True or false: a. The mean, median, and mode can...Ch. 2 - Bad statistic A teacher summarizes grades on an...Ch. 2 - True or false: Soccer According to a story in the...Ch. 2 - Mean for grouped data Refer to the calculation of...Ch. 2 - Prob. 142CPCh. 2 - Range and standard deviation approximation Use the...Ch. 2 - Range the least resistant Weve seen that measures...Ch. 2 - Using MAD to measure variability The standard...Ch. 2 - Prob. 146CPCh. 2 - Create own data For the Mean Versus Median web...
Knowledge Booster


Learn more about
Need a deep-dive on the concept behind this application? Look no further. Learn more about this topic, statistics and related others by exploring similar questions and additional content below.Similar questions
- The data in Table 7–6 were collected in a clinical trial to evaluate a new compound designed to improve wound healing in trauma patients. The new compound was com- pared against a placebo. After treatment for 5 days with the new compound or placebo, the extent of wound heal- ing was measured. Is there a difference in the extent of wound healing between the treatments? (Hint: Are treat- ment and the percent wound healing independent?) Run the appropriate test at a 5% level of significance. Can you please show how to do it in excel. Treatment 0-25% 26-50% 51-75% 76-100% New Compound (n=125) 15 37 32 41 Placebo (n=125) 36 45 34 10arrow_forwardA cohort study is conducted to assess the association between clinical characteristics and the risk of stroke. The study involves n=1,250 participants who are free of stroke at the study start. Each participant is assessed at study start (baseline) and every year thereafter for five years. The following table displays data on hypertensive status measured at baseline and incident stroke over 5 years. Free of Stroke over 5 Years Stroke Baseline: Not Hypertensive 952 46 Baseline: Hypertensive 234 18 Compute the cumulative incidence of stroke in the study.arrow_forwardA better drug? In a pilot study, a company's new cholesterol-reducing drug outperforms the currently available drug. If the data provide convincing evi- dence that the mean cholesterol reduction with the new drug is more than 10 milligrams per deciliter of blood (mg/dl) greater than with the current drug, the company will begin the expensive process of mass-producing the new drug. For the 14 subjects who were assigned at random to the current drug, the mean cholesterol reduction was 54.1 mg/dl with a standard deviation of 11.93 mg/dl. For the 15 sub- jects who were randomly assigned to the new drug, the mean cholesterol reduction was 68.7 mg/dl with a standard deviation of 13.3 mg/dl. Graphs of the data reveal no outliers or strong skewness. Carry out an appropriate significance test. What conclusion would you draw? (Note that the null hypothesis is not Ho: μμ2=0.) Based on your conclusion in part (a), could you have made a Type I error or a Type II error? Justify your answer.arrow_forward
- Are seatbelts effective at saving lives? We wish to examine whether or not the use of seatbelts reduces fatalities at the a = 0.01 level of significance. Let pN represent the proportion of non-seatbelt wearing passengers who were involved in a crash and died and py represent the proportion of seatbelt wearing passengers who were involved in a crash and died. NOTE: The data used in this study were obtained through observational study...no experiment was conducted! Which would be correct hypotheses for this test? O Ho:PN = pY, H1:PN > pY Ho: PN = pY, H,:PN Py In a random sample of 321 non-seatbelt wearing passengers involved in a car crash, 30 were killed. In a random sample of 492 seatbelt wearing passengers involved in a car crash, 13 were killed. Find the test statistic (2 decimal places): Give the P-value (4 decimal places - if less than 0.001 answer 0): Which is the correct result: Reject the Null Hypothesis O Do not Reject the Null Hypothesis Which would be the appropriate…arrow_forwardA study was performed looking at the risk of fractures in three rural Iowa communities according to whether their drinking water was “higher calcium,” “higher fluorides,” or “control” as determined by water samples. Table 11.10 presents data comparing the rate of fractures (over 5 years) between the higher-calcium vs the control communities for women ages 20–35 and 55–80, respectively . Table 11.10 Relationship of calcium content of drinking water to the rate of fractures in rural Iowa Ages 20-35 Number of women with fractures Total number of women Ages 55-80 Number of woemn with fractures Total number of women Control 3 37 Control 11 121 High calcium 1 33 High calcium 21 148 13.1 What test can be used to compare the fracturerates in these two communities while controlling for age? 13.2 Implement the test in Problem 13.1, report a p-value, and make a conclusion on relationship between drinking water calcium concentration and rate of fracture based on the p-value.arrow_forwardA study was performed looking at the risk of fractures in three rural Iowa communities according to whether their drinking water was “higher calcium,” “higher fluorides,” or “control” as determined by water samples. Table 11.10 presents data comparing the rate of fractures (over 5 years) between the higher-calcium vs the control communities for women ages 20–35 and 55–80, respectively . Table 11.10 Relationship of calcium content of drinking water to the rate of fractures in rural Iowa Ages 20-35 Number of women with fractures Total number of women Ages 55-80 Number of woemn with fractures Total number of women Control 3 37 Control 11 121 High calcium 1 33 High calcium 21 148 13.1 What test can be used to compare the fracturerates in these two communities while controlling for age? 13.2 Implement the test in Problem 13.1, report a p-value, and make a conclusion on relationship between drinking water calcium concentration and rate of fracture based on the p-value. 13.3…arrow_forward
- Welsh, Davis, Burke, and Williams (2002) conducted a study to evaluate the effectiveness of a carbohydrate-electrolyte drink on sports performance and endurance. Experienced athletes were given either a carbohydrate-electrolyte drink or a placebo while they were tested on a series of high-intensity exercises. One measure was how much time it took for the athletes to run to fatigue. Data similar to the results obtained in the study are shown in the following table. Time to Run to Fatigue (in minutes) Mean SE Placebo 21.7 2.2 Carbohydrate- electrolyte 28.6 2.7 a) Construct a bar graph that incorporates all of the information in the table. b) Looking at your graph, do you think that the carbohydrate-electrolyte drink helps performance?arrow_forwardevicard The use of both alcohol and tobacco by high school senibrs has declined in the last 30 years. Alcohol use is down from 68.2% to 43.1%, and the use of cigarettes by high school seniors has decreased from 36.7% to 20.4%. A random sample of 300 high school seniors from a large city indicated that 54 had smoked a cigarette during the 30 days prior to the survey. At the a = 0.05 level of significance is this lower than the national average?arrow_forwardwhat is the difference between t-statistic and z-statistic ? Compare the t-statistic formula and the z-statistic formula?arrow_forward
- The dose-response effect is best described as A. when similar studies produce similar results B. when all other possible causes are ruled out. C. when the value of the response variable changes in a meaningful way with the dosage of the suspected cause.arrow_forwardHeight and Breast Cancer. In the article “Height and Weight at Various Ages and Risk of Breast Cancer” (Annals of Epidemiology, Vol. 2, pp. 597–609), L. Brinton and C. Swanson discussed the relationship between height and breast cancer. The study, sponsored by the National Cancer Institute, took 5 years and involved more than 1500 women with breast cancer and 2000 women without breast cancer; it revealed a trend between height and breast cancer: “. . . taller women have a 50 to 80 percent greater risk of getting breast cancer than women who are closer to 5 feet tall.” Christine Swanson, a nutritionist who was involved with the study, added, “. . . height may be associated with the culprit, . . . but no one really knows” the exact relationship between height and the risk of breast cancer. a. Classify this study as either an observational study or a designed experiment. Explain your answer. b. Interpret the statement made by Christine Swanson in light of your answer to part (a).arrow_forwardA study was conducted to examine the effect of diet cola consumption on calcium levels in women. A sample of 16 healthy women aged 18 to 40 were randomly assigned to drink 24 ounces of either diet cola or water. Their urine was collected for three hours after ingestion of the beverage and calcium excretion (in mg) was measured. The data are stored in ColaCalcium.arrow_forward
arrow_back_ios
SEE MORE QUESTIONS
arrow_forward_ios
Recommended textbooks for you
 Glencoe Algebra 1, Student Edition, 9780079039897...AlgebraISBN:9780079039897Author:CarterPublisher:McGraw Hill
Glencoe Algebra 1, Student Edition, 9780079039897...
Algebra
ISBN:9780079039897
Author:Carter
Publisher:McGraw Hill
Hypothesis Testing using Confidence Interval Approach; Author: BUM2413 Applied Statistics UMP;https://www.youtube.com/watch?v=Hq1l3e9pLyY;License: Standard YouTube License, CC-BY
Hypothesis Testing - Difference of Two Means - Student's -Distribution & Normal Distribution; Author: The Organic Chemistry Tutor;https://www.youtube.com/watch?v=UcZwyzwWU7o;License: Standard Youtube License