
Concept explainers
Videos
Recall that in exercise 45 the personnel director for Electronics Associates developed the following estimated regression equation relating an employee’s score on a job satisfaction test to length of service and wage rate.
where
x1 = length of service (years)
x2 = wage rate (dollars)
y = job satisfaction test score (higher scores indicate greater job satisfaction)
A portion of the Excel Regression tool output follows.
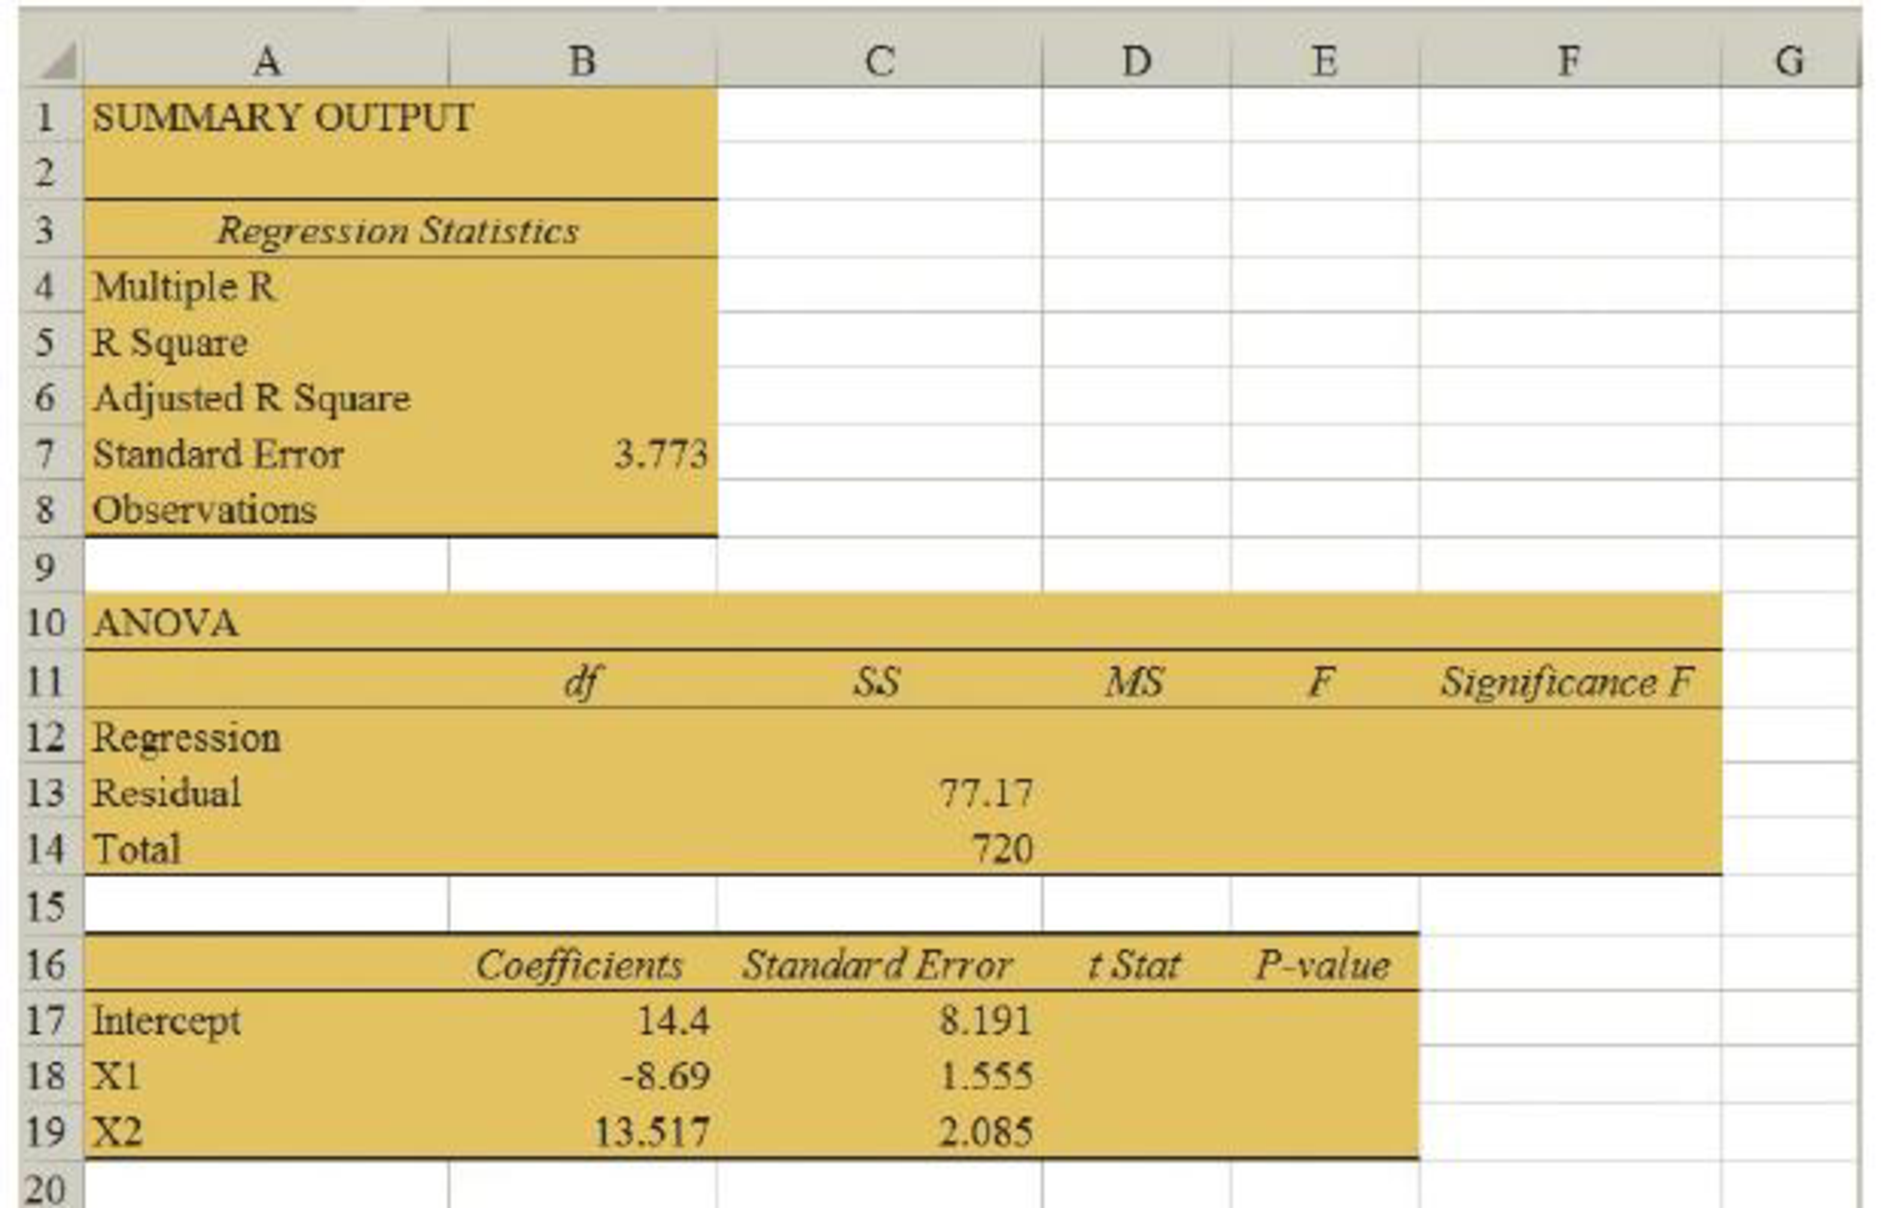
- a. Complete the missing entries in this output.
- b. Using α = .05, test for overall significance.
- c. Did the estimated regression equation provide a good fit to the data? Explain.
- d. Use the t test and α = .05 to test H0: β1 = 0 and H0: β2 = 0.
45. The personnel director for Electronics Associates developed the following estimated regression equation relating an employee’s score on a job satisfaction test to his or her length of service and wage rate.
where
x1 = length of service (years)
x2 = wage rate (dollars)
y = job satisfaction test score (higher scores indicate greater job satisfaction)
- a. Interpret the coefficients in this estimated regression equation.
- b. Predict the job satisfaction test score for an employee who has four years of service and makes $6.50 per hour.
Want to see the full answer?
Check out a sample textbook solution
Chapter 15 Solutions
Modern Business Statistics with Microsoft Office Excel (with XLSTAT Education Edition Printed Access Card) (MindTap Course List)


- What is regression analysis? Describe the process of performing regression analysis on a graphing utility.arrow_forwardIf your graphing calculator is capable of computing a least-squares sinusoidal regression model, use it to find a second model for the data. Graph this new equation along with your first model. How do they compare?arrow_forwardRespiratory Rate Researchers have found that the 95 th percentile the value at which 95% of the data are at or below for respiratory rates in breath per minute during the first 3 years of infancy are given by y=101.82411-0.0125995x+0.00013401x2 for awake infants and y=101.72858-0.0139928x+0.00017646x2 for sleeping infants, where x is the age in months. Source: Pediatrics. a. What is the domain for each function? b. For each respiratory rate, is the rate decreasing or increasing over the first 3 years of life? Hint: Is the graph of the quadratic in the exponent opening upward or downward? Where is the vertex? c. Verify your answer to part b using a graphing calculator. d. For a 1- year-old infant in the 95 th percentile, how much higher is the walking respiratory rate then the sleeping respiratory rate? e. f.arrow_forward
- Find the equation of the regression line for the following data set. x 1 2 3 y 0 3 4arrow_forwardDoes Table 1 represent a linear function? If so, finda linear equation that models the data.arrow_forwardWhat does the y -intercept on the graph of a logistic equation correspond to for a population modeled by that equation?arrow_forward
 Functions and Change: A Modeling Approach to Coll...AlgebraISBN:9781337111348Author:Bruce Crauder, Benny Evans, Alan NoellPublisher:Cengage Learning
 Calculus For The Life SciencesCalculusISBN:9780321964038Author:GREENWELL, Raymond N., RITCHEY, Nathan P., Lial, Margaret L.Publisher:Pearson Addison Wesley,
 Algebra & Trigonometry with Analytic GeometryAlgebraISBN:9781133382119Author:SwokowskiPublisher:Cengage
 Algebra and Trigonometry (MindTap Course List)AlgebraISBN:9781305071742Author:James Stewart, Lothar Redlin, Saleem WatsonPublisher:Cengage Learning
 Glencoe Algebra 1, Student Edition, 9780079039897...AlgebraISBN:9780079039897Author:CarterPublisher:McGraw Hill