
Introduction To Statistics And Data Analysis
6th Edition
ISBN: 9781337793612
Author: PECK, Roxy.
Publisher: Cengage Learning,
expand_more
expand_more
format_list_bulleted
Videos
Textbook Question
Chapter 1.4, Problem 20E
Box Office Mojo (boxofficemojo.com) tracks movie ticket sales. Ticket sales (in millions of dollars) for each of the top 20 movies in 2014 and 2015 are shown in the accompanying table.
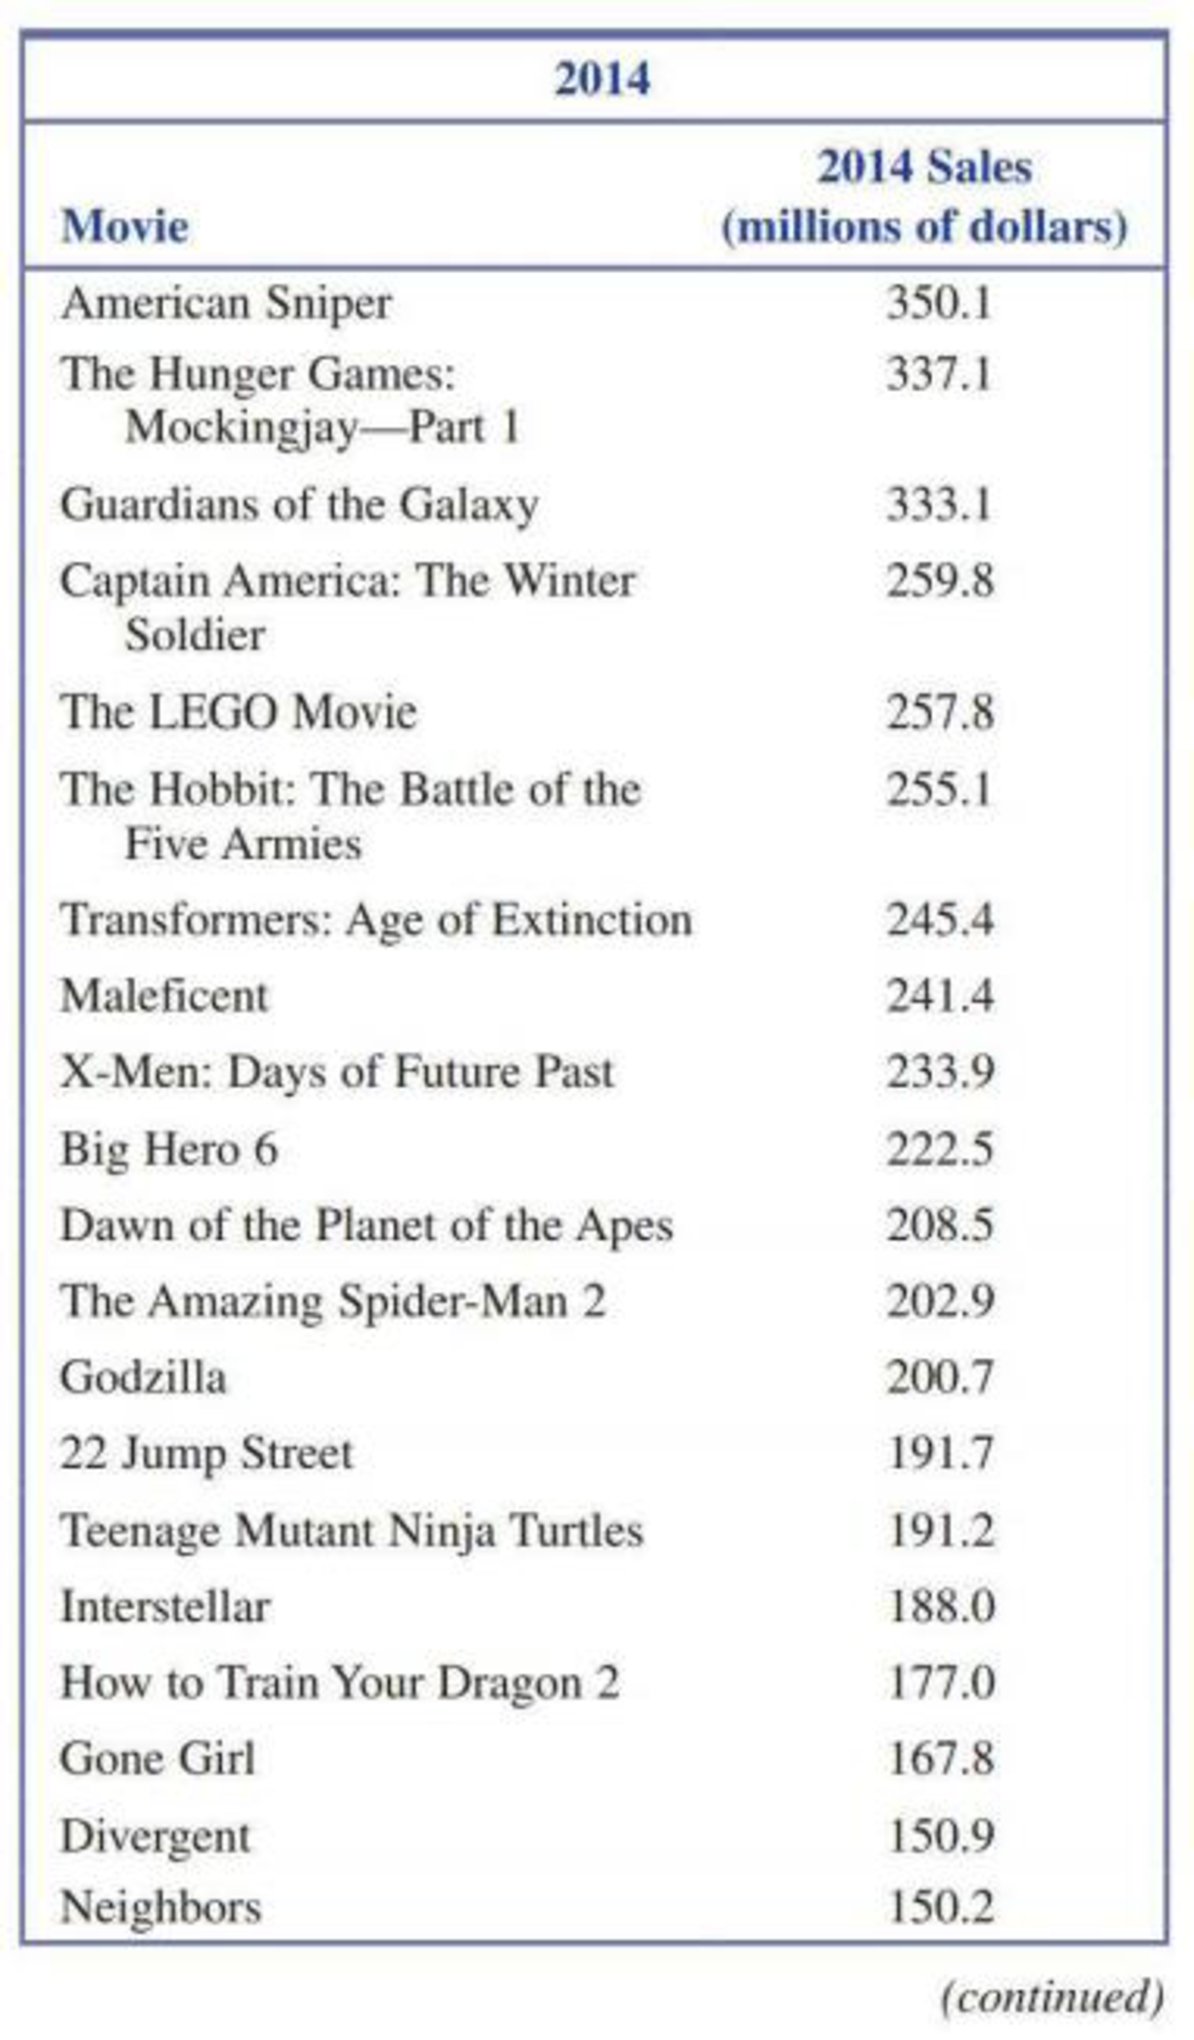
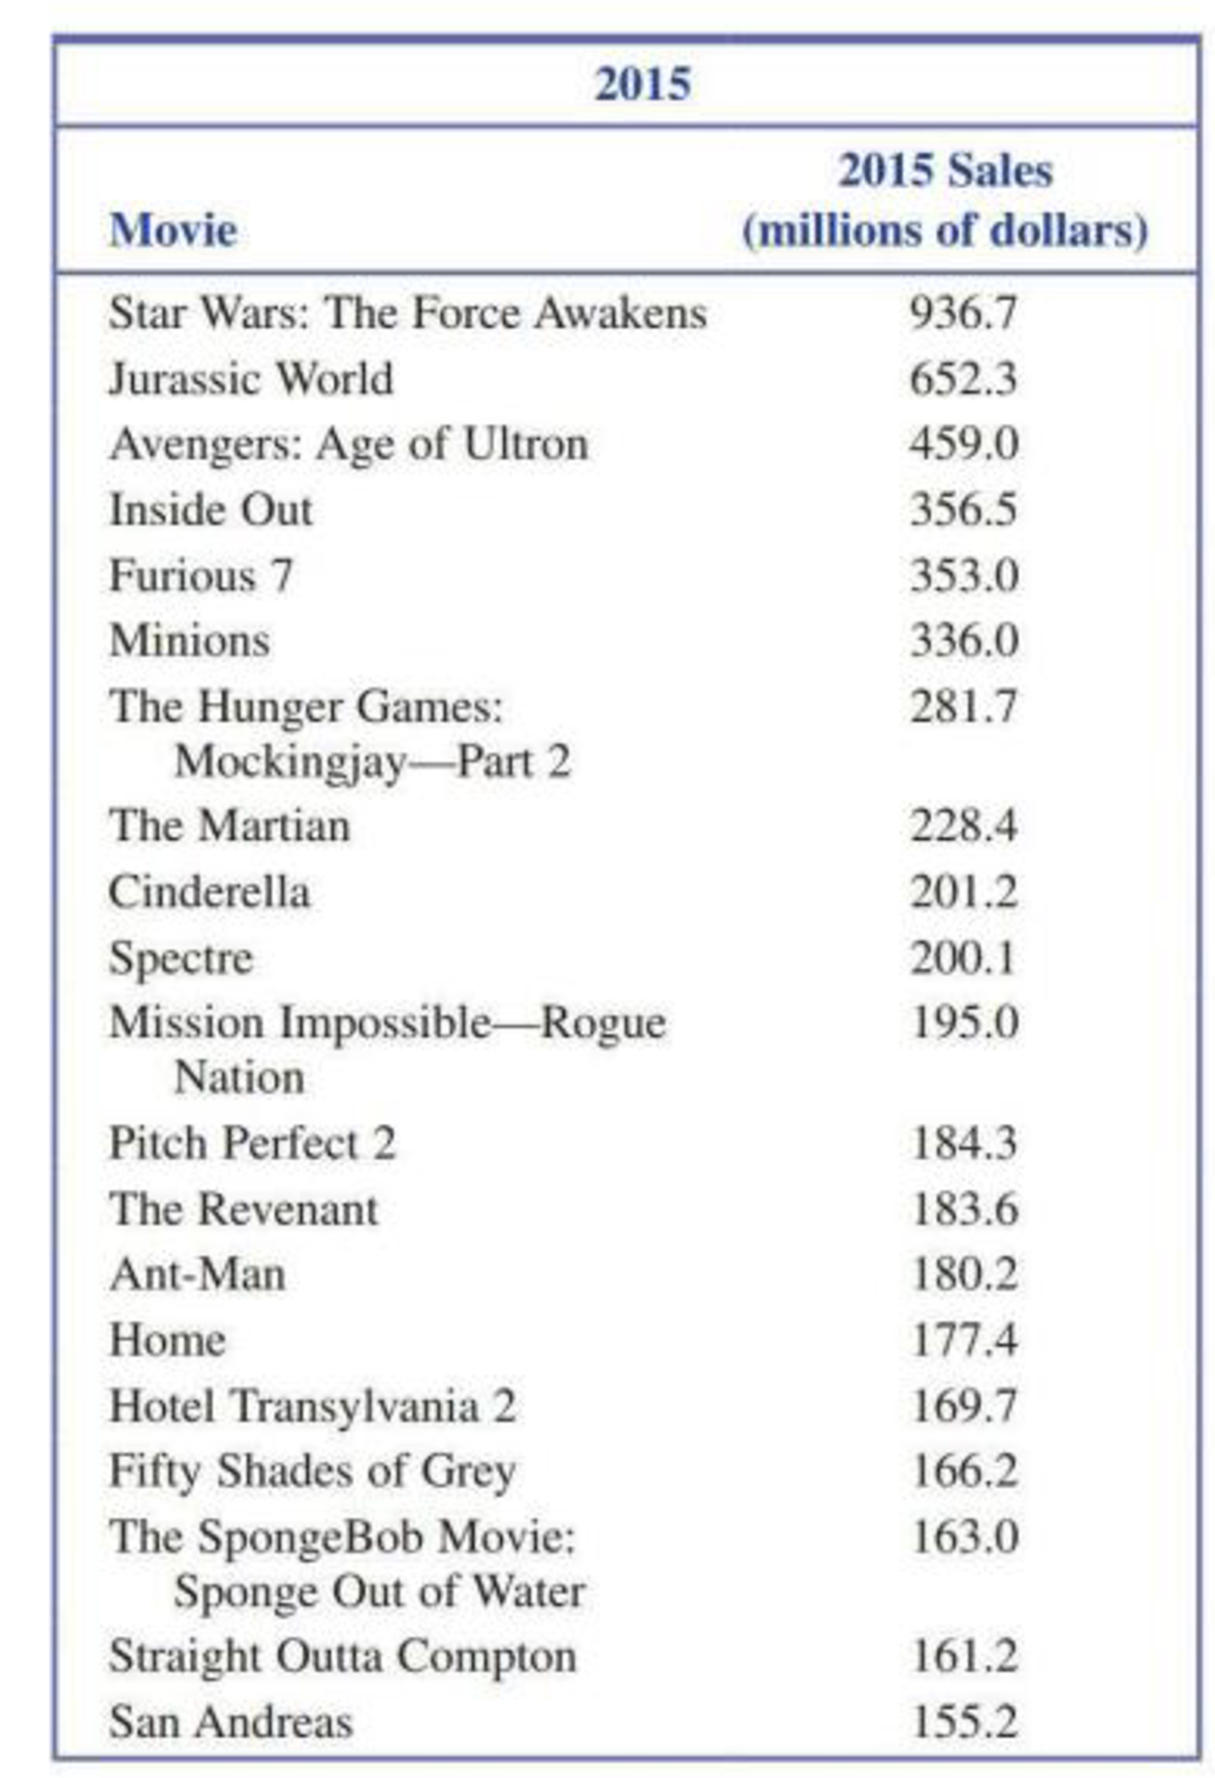
- a. Construct a dotplot of the 2014 ticket sales data. Comment on any interesting features of the dotplot. (Hint: See “What to Look For” in the Dotplots box on page 14.)
- b. Construct a dotplot of the 2015 ticket sales data. Comment on any interesting features of the dotplot.
- c. In what ways are the distributions of the 2014 and 2015 ticket sales observations similar? In what ways are they different?
Expert Solution & Answer

Trending nowThis is a popular solution!

Students have asked these similar questions
Please refer to table. Thanks!
MarkLines is an online portal (www.marklines.com) that reports automotive industry data. The table below shows the number of cars sold in the United States from January to November in 2017 and 2018. The top 22 manufacturers, plus others, are listed here. Sales data often is reported in this way to compare current sales to last year’s sales.
Car Sales
Manufacturer
Jan.-Nov.2017
Jan.-Nov.2018
GM (Est.)
2,691,493
2,654,568
Ford
2,334,290
2,265,590
Toyota
2,211,533
2,205,762
Fiat Chrysler
1,887,430
2,038,684
Honda
1,492,112
1,449,713
Nissan
1,455,238
1,345,157
Hyundai
621,961
612,225
Subaru
584,614
615,594
Kia
546,629
542,245
Mercedes (includes Sprinter)
332,990
318,012
BMW
271,432
276,657
VW
309,395
322,017
Mazda
262,577
274,455
Audi
199,534
200,558
Tesla (Est.)
40,320
106,050
Land Rover
66,759
81,526
Volvo
71828
89437
Mitsubishi
95,185
109,088
Porsche
51,507
53,116
MINI
42,494
40,887
Jaguar
36,180
27,021
Others
18,901
17,251
smart…
Each week the Wall Street Journal and Harris Interactive track the opinions and experiences of college recruiters for large corporations and summarize the results in the Business School Survey. Data have been gathered for the top 10 business schools from a list of 76 and is summarized below.
Please complete the questions below and upload this document and your EXCEL document to the portal in CANVAS.
School
Ranking
Enrollment
(# of full-time students)
Annual Tuition
($)
Mean GMAT
% with Job Offer
Average Salary ($)
Dartmouth
1
503
38,400
704
89
119,800
Michigan
2
1873
33,076
690
91
105,986
Carnegie Mellon
3
661
38,800
691
93
95,531
Northwestern
4
2650
38,844
700
94
117,060
Yale
5
468
36,800
696
86
104,018
Pennsylvania
6
1840
40,458
716
92
117,471
California Berkeley
7
1281
21,512
701
92
112,699
Columbia
8
1796
38,290
709
95
126,319
North…
Chapter 1 Solutions
Introduction To Statistics And Data Analysis
Ch. 1.3 - Give brief definitions of the terms descriptive...Ch. 1.3 - Give brief definitions of the terms population and...Ch. 1.3 - The following conclusion from a study appeared in...Ch. 1.3 - Based on a study of 2 121 children between the...Ch. 1.3 - The student senate at a university with 15,000...Ch. 1.3 - The National Retail Federation used data from a...Ch. 1.3 - The supervisors of a rural county are interested...Ch. 1.3 - A consumer group conducts crash tests of new model...Ch. 1.3 - A building contractor has a chance to buy an odd...Ch. 1.3 - The article Brain Shunt Tested to Treat Alzheimers...
Ch. 1.3 - In a study of whether taking a garlic supplement...Ch. 1.4 - Classify each of the following variables as either...Ch. 1.4 - Classify each of the following variables as either...Ch. 1.4 - For the following numerical variables, state...Ch. 1.4 - For the following numerical variables, state...Ch. 1.4 - For each of the following situations, give a set...Ch. 1.4 - In a survey of 100 people who had recently...Ch. 1.4 - The Gallup report More Americans Say Real Estate...Ch. 1.4 - An article in the New Times San Luis Obispo...Ch. 1.4 - Box Office Mojo (boxofficemojo.com) tracks movie...Ch. 1.4 - The report With Their Whole Lives Ahead of Them...Ch. 1.4 - The following display is a graph similar to one...Ch. 1.4 - The accompanying table gives the total number...Ch. 1.4 - Heal the Bay is an environmental organization that...Ch. 1.4 - The report referenced in the previous exercise...Ch. 1.4 - The U.S. Department of Health and Human Services...Ch. 1.4 - Example 1.5 gave the accompanying data on violent...Ch. 1.4 - The article Fliers Trapped on Tarmac Push for...Ch. 1.4 - The report Trends m Community Colleges...Ch. 1.4 - The article Where College Students Buy Textbooks...Ch. 1.4 - Prob. 31ECh. 1.4 - In the United States, movies are rated by the...Ch. 1 - The report Testing the Waters 2009 (nrdc.org)...Ch. 1 - The U.S. Department of Education reported that 14%...Ch. 1 - The Computer Assisted Assessment Center at the...Ch. 1 - The article Just How Safe Is That Jet? (USA TODAY,...Ch. 1 - Each year, U.S. News and World Report publishes a...Ch. 1 - Many adolescent boys aspire to be professional...
Knowledge Booster


Learn more about
Need a deep-dive on the concept behind this application? Look no further. Learn more about this topic, statistics and related others by exploring similar questions and additional content below.Similar questions
- Kindly fill data in box. Show complete examples. Thank youarrow_forwardBlock: _ Date. Five year-old Susie's parents are concerned that she seems short for her age. Their doctor has the followng rer of Susie' height: Age (months): 20 30 45 50 57 60 Height (cm): 80 86 87 90 91 94 (a) Make a scatterplot of these data:arrow_forwardSuppose you need to summarize ordinal data in a bar graph. How would you arrange the categories of data on the horizontal axis? Is it possible to make the order of the data apparent in a pie chart?arrow_forward
- The Toyota Camry is one of the best-selling cars in North America. The cost of a previously owned Camry depends on many factors, including the model year, mileage, and condition. To investigate the relationship between the car's mileage and the sales price for Camrys, the following data show the mileage and sale price for 19 sales (PriceHub web site, February 24, 2012). DATA file Miles (1,000s) Price ($1,000s) 22 16.2 29 16.0 36 13.8 47 11.5 63 12.5 77 12.9 73 11.2 87 13.0 92 11.8 101 10.8 110 8.3 28 12.5 59 11.1 68 15.0 68 12.2 91 13.0 42 15.6 65 12.7 110 8.3arrow_forwardConstruct the Box-plot of the ages of the 100 employees.arrow_forwardSite images for background and question.arrow_forward
arrow_back_ios
SEE MORE QUESTIONS
arrow_forward_ios
Recommended textbooks for you
 Algebra: Structure And Method, Book 1AlgebraISBN:9780395977224Author:Richard G. Brown, Mary P. Dolciani, Robert H. Sorgenfrey, William L. ColePublisher:McDougal Littell
 Glencoe Algebra 1, Student Edition, 9780079039897...AlgebraISBN:9780079039897Author:CarterPublisher:McGraw Hill
Algebra: Structure And Method, Book 1
Algebra
ISBN:9780395977224
Author:Richard G. Brown, Mary P. Dolciani, Robert H. Sorgenfrey, William L. Cole
Publisher:McDougal Littell
Glencoe Algebra 1, Student Edition, 9780079039897...
Algebra
ISBN:9780079039897
Author:Carter
Publisher:McGraw Hill
What Are Research Ethics?; Author: HighSchoolScience101;https://www.youtube.com/watch?v=nX4c3V23DZI;License: Standard YouTube License, CC-BY
What is Ethics in Research - ethics in research (research ethics); Author: Chee-Onn Leong;https://www.youtube.com/watch?v=W8Vk0sXtMGU;License: Standard YouTube License, CC-BY