
Cornerstones of Financial Accounting
4th Edition
ISBN: 9781337690881
Author: Jay Rich, Jeff Jones
Publisher: Cengage Learning
expand_more
expand_more
format_list_bulleted
Videos
Textbook Question
Chapter 12, Problem 99.1C
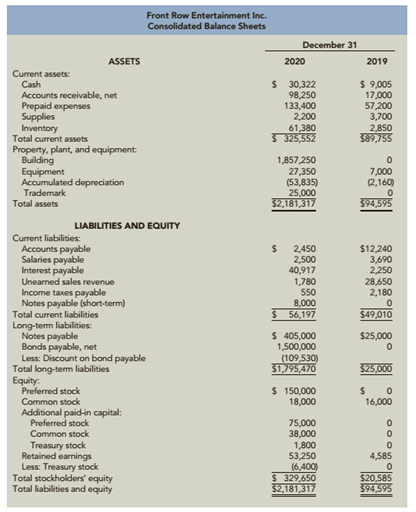
CONTINUING PROBLEM: FRONT ROW ENTERTAINMENT
The income statement and consolidated balance sheets for Front Row Entertainment follow.
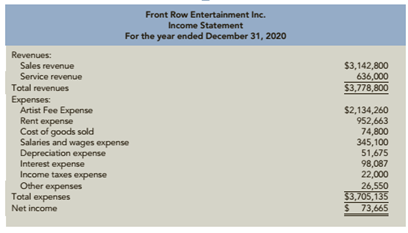
Front Row Entertainment Inc. Income Statement
Required:
Calculate the short-term
Expert Solution & Answer

Trending nowThis is a popular solution!

Students have asked these similar questions
Using the financiaql statements of Top Glove Corporation Berhad for the year 2020, provide and comment on the following:
Calculate the profitability, liquidity and effiency ratios of the Top Glove Corporation Berhad company (use the following ratios: gross profit margin, net profit margin, return on capital employed, quick ratio, current ratio, accounts receivable turnover, accounts payables turnover, inventory turnover) for the year 2019 and 2020.
The image uploaded is the calculation of Access Bank's Profitability ratios, shorter liquidity ratios, long-term liquidity ratios, and investment ratios for 2020, 2021, 2022. A base year of 2019 was also added. Evaluate the financial performance by comparing the three (3) years' financial performance that is 2020, 2021, and 2022 I have provided in the table with the base year.
Income statement and balance sheet data for The Athletic Attic are provided below.Required: 1. Calculate the following risk ratios for 2021 and 2022: a. Receivables turnover ratio. c. Current ratio. b. Inventory turnover ratio. d. Debt to equity ratio. 2. Calculate the following profitability ratios for 2021 and 2022: a. Gross profit ratio. c. Profit margin. b. Return on assets. d. Asset turnover. 3. Based on the ratios calculated, determine whether overall risk and profitability improved from 2021 to 2022.
Chapter 12 Solutions
Cornerstones of Financial Accounting
Ch. 12 - Describe how some of the primary groups of users...Ch. 12 - Prob. 2DQCh. 12 - Prob. 3DQCh. 12 - Prob. 4DQCh. 12 - Prob. 5DQCh. 12 - Prob. 6DQCh. 12 - Prob. 7DQCh. 12 - Prob. 8DQCh. 12 - Prob. 9DQCh. 12 - Prob. 10DQ
Ch. 12 - Prob. 11DQCh. 12 - 12. Why are higher asset turnover ratios...Ch. 12 - Prob. 13DQCh. 12 - Prob. 14DQCh. 12 - Prob. 15DQCh. 12 - Prob. 16DQCh. 12 - Which of the following use financial statement...Ch. 12 - Prob. 2MCQCh. 12 - Prob. 3MCQCh. 12 - Prob. 4MCQCh. 12 - Prob. 5MCQCh. 12 - Prob. 6MCQCh. 12 - Prob. 7MCQCh. 12 - Which type of analysis compares a single...Ch. 12 - Which of the following types of analysis compares...Ch. 12 - Which of the following types of analysis is...Ch. 12 - Prob. 11MCQCh. 12 - Prob. 12MCQCh. 12 - Prob. 13MCQCh. 12 - Partial information from Fabray Companys balance...Ch. 12 - Hummel Inc. has $30,000 in current assets and...Ch. 12 - Prob. 16MCQCh. 12 - A firms quick ratio is typically computed as: a....Ch. 12 - Prob. 18MCQCh. 12 - Prob. 19MCQCh. 12 - Prob. 20MCQCh. 12 - Prob. 21MCQCh. 12 - Prob. 22MCQCh. 12 - Prob. 23MCQCh. 12 - When analyzing a companys debt to equity ratio,...Ch. 12 - Prob. 25MCQCh. 12 - Prob. 26MCQCh. 12 - Prob. 27MCQCh. 12 - Prob. 28MCQCh. 12 - Prob. 29MCQCh. 12 - Prob. 30MCQCh. 12 - Which of the following ratios is used to measure...Ch. 12 - Prob. 32MCQCh. 12 - Selected information for Berry Company is as...Ch. 12 - Which of the following ratios is used to measure a...Ch. 12 - Prob. 35MCQCh. 12 - Prob. 36MCQCh. 12 - Prob. 37MCQCh. 12 - Prob. 38MCQCh. 12 - Which of the following are not part of common...Ch. 12 - Prob. 40MCQCh. 12 - Prob. 41MCQCh. 12 - Prob. 42MCQCh. 12 - Which of the following is not included in the...Ch. 12 - When a Dupont analysis reveals that a company has...Ch. 12 - Prob. 45MCQCh. 12 - Cross Sectional Analysis Cross sectional analysis...Ch. 12 - Prob. 47CECh. 12 - Prob. 48CECh. 12 - Short-Term Liquidity Ratios Three ratios...Ch. 12 - Debt Management Ratios Selected data from the...Ch. 12 - Debt Management and Short-Term Liquidity Ratios...Ch. 12 - Asset Efficiency Ratios Selected financial...Ch. 12 - Profitability Ratios The following data came from...Ch. 12 - Prob. 54CECh. 12 - Prob. 55CECh. 12 - Prob. 56CECh. 12 - Prob. 57BECh. 12 - Prob. 58BECh. 12 - Prob. 59BECh. 12 - Short-Term Liquidity Ratios Larry, Curly, and Moe...Ch. 12 - Debt Management Ratios Glow Corporation provides...Ch. 12 - Debt Management and Short-Term Liquidity Ratios...Ch. 12 - Asset Efficiency Ratios Rumsford Inc.s financial...Ch. 12 - Prob. 64BECh. 12 - Profitability Ratios Tinker Corporation operates...Ch. 12 - Profitability Ratios Katrina Corp. is a publicly...Ch. 12 - Prob. 67BECh. 12 - Prob. 68ECh. 12 - Prob. 69ECh. 12 - Prob. 70ECh. 12 - Prob. 71ECh. 12 - Horizontal Analysis of Income Statements...Ch. 12 - Prob. 73ECh. 12 - Prob. 74ECh. 12 - Prob. 75ECh. 12 - Prob. 76ECh. 12 - Prob. 77ECh. 12 - Prob. 78ECh. 12 - Prob. 79ECh. 12 - Asset Efficiency Ratios Refer to financial...Ch. 12 - Prob. 81ECh. 12 - Prob. 82ECh. 12 - Prob. 83ECh. 12 - Prob. 84PSACh. 12 - Prob. 85PSACh. 12 - Prob. 86PSACh. 12 - A Using Common Size Statements The following...Ch. 12 - Prob. 88PSACh. 12 - Prob. 89PSACh. 12 - Prob. 90PSACh. 12 - A Comparing Financial Ratios Presented below are...Ch. 12 - A Preparation of Ratios Refer to the financial...Ch. 12 - Accounting Alternatives and Financial Analysis...Ch. 12 - Prob. 84PSBCh. 12 - Prob. 85PSBCh. 12 - Prob. 86PSBCh. 12 - Prob. 87PSBCh. 12 - Prob. 88PSBCh. 12 - Prob. 89PSBCh. 12 - Prob. 90PSBCh. 12 - Comparing Financial Ratios Presented below are...Ch. 12 - Prob. 92PSBCh. 12 - Problem 1 2-93B Accounting Alternatives and...Ch. 12 - Prob. 94CCh. 12 - Prob. 95.1CCh. 12 - Prob. 95.2CCh. 12 - Prob. 96.1CCh. 12 - Prob. 96.2CCh. 12 - Prob. 97.1CCh. 12 - Prob. 97.2CCh. 12 - Prob. 97.3CCh. 12 - Prob. 97.4CCh. 12 - Analyzing Growth Consolidated financial statements...Ch. 12 - Analyzing Growth Consolidated financial statements...Ch. 12 - Prob. 98.1CCh. 12 - Prob. 98.2CCh. 12 - Prob. 98.3CCh. 12 - CONTINUING PROBLEM: FRONT ROW ENTERTAINMENT The...Ch. 12 - Prob. 99.2CCh. 12 - Prob. 99.3CCh. 12 - Prob. 99.4CCh. 12 - Prob. 99.5C
Knowledge Booster


Learn more about
Need a deep-dive on the concept behind this application? Look no further. Learn more about this topic, accounting and related others by exploring similar questions and additional content below.Similar questions
- Short-Term Liquidity Ratios Three ratios calculated for Puckerman, Cohen, and Chang companies for 2018 and 2019 follow. Required: Explain which company appears to be the most liquid.arrow_forwardProblem 1: Viance Queen Company Required: Compute for the company’s profitability and operating efficiency ratios for 2019 Compute for the financial health ratios of the company for 2019 A.Profitability ratio Return on Assets: ROA (EBIT/Average Assets) ROE (NI/Capital) ROE (NI/Average Capitalarrow_forwardLiquidity management Bauman Company's total current assets, total current liabilities, and inventory for each of the past 4 years follow Item 2019 2020 2021 Total current assets $17,440 $21,630 $22,920 Total current liabilities 12,890 9,090 5.270 Inventory 6,560 Hem a. Calculate the firm's current and quick ratios for each year. Compare the resulting time series for these measures of liquidity b. Comment on the firm's liquidity over the 2019-2022 period c. If you were told that Bauman Company's inventory turnover for each year in the 2019-2022 penod and the industry averages were as follows, would this information support or conflict with your evaluation in part (b)? Why? 2019 2020 12,630 7,230 a. Calculate the firm's current and quick ratios for each year. 2022 $26,480 16,920 7,510 2021 2022 LLLarrow_forward
- The image uploaded is the calculation of Cal Bank's Profitability ratios, shorter liquidity ratios, long-term liquidity ratios, and investment ratios for 2020, 2021, 2022. A base year of 2019 was also added. Evaluate the financial performance by comparing the three (3) years' financial performance that is 2020, 2021, and 2022 I have provided in the table with the base year.arrow_forwardPrepare a financial statement analysis in terms of liquidity, solvency, profitability and efficiency of the following company. Financial Ratios Fiscal Year Ended Previous Fiscal Year Formula Dec 31, 2019 Dec 31, 2018 Liquidity Analysis Ratios: Current Assets / Current Liabilities Current Ratio or 1.46 1.36 Working Capital Ratio (Current Assets - Inventory - Prepayments) / Current Liabilities Quick Ratio 0.96 0.86 Solvency Ratio Total Assets / Total Liabilities 1.46 1.44 Financial Leverage Ratios Debt Ratio Total Debt/Total Assets 0.47 0.48 Total Debt/Total Stockholders Equity Debt-to-Equity Ratio 1.48 1.57 Earnings Before Interest and Taxes (EBIT) / Interest Charges Total Assets / Total Stockholders' Equity Interest Coverage 2.38 2.61 Asset to Equity Ratio 3.16 3.28 Profitability Ratios Gross Profit Margin Sales - Cost of Goods Sold or Cost of Service / Sales 19.76 19.43 Net Profit Margin Net Profit / Sales 11.34 11.42 Net Income / Total Assets 2.67 2.9 Return on Assets Net Income /…arrow_forwardProblem 1: Viance Queen Company Required: Compute for the company’s profitability and operating efficiency ratios for 2019 Compute for the financial health ratios of the company for 2019 A.Profitability ratio a. Return on Assets: ROA (NI/Total Assets) ROA (NI/Average Assets) ROA (EBIT/Total Assets) ROA (EBIT/Average Assets) ROE (NI/Capital) ROE (NI/Average Capitalarrow_forward
- Ratio Analysis Based on the Income Statement and Balance Sheet, complete the table below. Then comment on the liquidity, profitability, leverage, asset management and market value. Analysis of Financial Data (Table with ratios) Ratio Analysis 2021 Est. 2020 2019 Industry Average Liquidity Ratios Current Ratio (times) 4.2 Quick Ratio (times) 2.1 Asset Management Ratios Average sales/day 9 Inventory Turnover Ratio (times) 9 Days Sales Outstanding (days) 36 Fixed Assets Turnover Ratio (times) 3 Total Asset Turnover Ratio 1.8 Debt Management Ratios Total Debt to Total Assets (%) 40 Times Interest Earned (times) 6 Debt to Equity Ratio (%) 1 Profitability Ratios…arrow_forwardHello! look at the attached images and answee the following points: (a) Calculate ratios for the year ended 31 December 2021 (showing your workings) for Primrose Plc, equivalent to those provided above. Return on year-end capital employed Net asset turnover Gross profit margin Net profit margin Current ratio Closing inventory holding period Trade receivables’ collection period viii. Trade payables’ payment period Dividend yield Dividend cover (b) Analyse the financial performance and position of Primrose Plc for the year ended 31 December 2021 compared to 31 December 2020. (c) Explain the uses and the general limitations of ratio analysis. Thank you a lot!arrow_forwarda) Based on the information provided, calculate the following ratios for the years ended 31December 2021 and 2020.You should give the formula for each ratio, in addition to your calculation.I. Gross profit marginII. Operating profit marginIII. Return on equityIV. Current ratioV. Gearing b) By comparing the financial information for years ended 31 December 2021 and 2020, andreviewing your ratio calculations, comment on the profitability, liquidity, and long-termsolvency of Mabel’s business over the past year. You should use the other information givento suggest reasons for any changes identified. c)If an investor was interested in buying Mabel’s business and was presented with theseresults, what further advice would you give them?arrow_forward
- Analyze the financial statements of the company to you in terms of: 1. Debt Management Ratio * TIE Ratio or Time Interest Earned Ratio 2. Asset Management Ratio *Inventory Turnover Ratio *Fixed Asset Turnover Ratio *Total Asset Turnover Ratio 2020 Analysis BUT also compare with 2018 - 2019. Show solution on computaion.arrow_forwardBethesda Mining Company reports the following balance sheet information for 2018 and 2019. Calculate the following financial ratios for each year: current ratio? quick ratio? cash ratio? debt-equity ratio and equity multiplier? total debt ratio?arrow_forwardSolve the following finance question. Q: Compute the following financial ratios by taking/downloading an annual report for the year 2020 of the UNITY FOODS LIMITED. Profitability ratios Liquidity Ratios Debt Ratios Asset activity ratios Market value ratiosarrow_forward
arrow_back_ios
SEE MORE QUESTIONS
arrow_forward_ios
Recommended textbooks for you
 Cornerstones of Financial AccountingAccountingISBN:9781337690881Author:Jay Rich, Jeff JonesPublisher:Cengage Learning
 Intermediate Financial Management (MindTap Course...FinanceISBN:9781337395083Author:Eugene F. Brigham, Phillip R. DavesPublisher:Cengage Learning
Cornerstones of Financial Accounting
Accounting
ISBN:9781337690881
Author:Jay Rich, Jeff Jones
Publisher:Cengage Learning
Intermediate Financial Management (MindTap Course...
Finance
ISBN:9781337395083
Author:Eugene F. Brigham, Phillip R. Daves
Publisher:Cengage Learning
Financial ratio analysis; Author: The Finance Storyteller;https://www.youtube.com/watch?v=MTq7HuvoGck;License: Standard Youtube License