
Concept explainers
Videos
Skills and Applications
Population Statistics
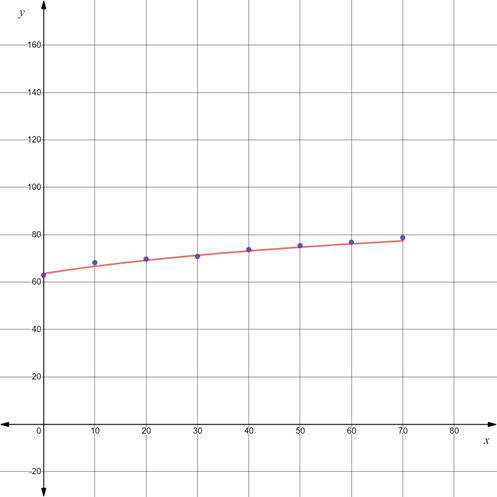
The table shows the life expectancies of a child (at birth) in the United States for selected years from 1940 through 2010. (Source: U.S. National Center for Health Statistics)
| Year | Life Expectancy,
|
| 1940 | 62.9 |
| 1950 | 68.2 |
| 1960 | 69.7 |
| 1970 | 70.8 |
| 1980 | 73.7 |
| 1990 | 75.4 |
| 2000 | 76.8 |
| 2010 | 78.7 |
The model for the life expectancy during this period is
where
(a) Use a graphing utility to graph the data from the table and the model in the same viewing window. How well does the model fit the data? Explain.
(b) Determine the life expectancy in 1990 both graphically and algebraically.
(c) Use the graph to determine the year when life expectancy was approximately 70.1. Verify your answer algebraically.
(d) Find the
(e) Do you think this model can be used to predict the life expectancy of a child 50 years from now? Explain.
Want to see the full answer?
Check out a sample textbook solution
Chapter 1 Solutions
Precalculus (MindTap Course List)


- Oil ProductionThe following table shows the amount of crude oil in billions of barrels produced in the United States in recent years. Source: U.S. Energy Information Administration. Year Crude Oil Produced 2002 2.097 2003 2.060 2004 1.989 2005 1.893 2006 1.857 2007 1.853 2008 1.830 2009 1.954 2010 2.000 2011 2.063 2012 2.377 In this exercise we are interested in the total amount of crude oil produced over the 10-year period from mid-2002 to mid-2012, using the data for the 11 years above. One approach is to sum up the numbers in the second column, but only count half of the first and last numbers. Give the answer to this calculation. Approximate the amount of crude oil produced over the 10-year period 2002-2012 by taking the average of the left endpoint sum and the right endpoint sum. Explain why this is equivalent to the calculation done in part a. This is also equivalent to a formula known as the trapezoidal rule, discussed in the next chapter. If your calculator has a cubic regression feature, find the best-fitting cubic function for these data, letting t=0 correspond to 2000. Then integrate this equation over the interval [2.12] to estimate the amount of crude oil produced over this time period. Compare with your answer to part a.arrow_forwardUsing the model in Example 6, estimate the number of cases of flu on day 15.arrow_forwardEXERCISES The following table gives the life expectancy at birth of females born in the United States in various years from 1970 to 2010. Source: National Center for Health Statistics. Year of Birth Life Expectancy years 1970 74.7 1975 76.6 1980 77.4 1985 78.2 1990 78.8 1995 78.9 2000 79.3 2005 79.9 2010 81.0 Find the life expectancy predicted by your regression equation for each year in the table, and subtract it from the actual value in the second column. This gives you a table of residuals. Plot your residuals as points on a graph.arrow_forward
- DVD Player Sales The table shows the number of DVD players sold in a small electronics store in the years 2003-2013. Year DVD players sold 2003 495 2004 513 2005 410 2006 402 2007 520 2008 580 2009 631 2010 719 2011 624 2012 582 2013 635 aWhat was the average rate of change of sales between 2003 and 2013? bWhat was the average rate of change of sales between 2003 and 2004? cWhat was the average rate of change of sales between 2004 and 2005? dBetween which two successive years did DVD player sales increase most quickly? Decrease most quickly?arrow_forwardEnergy ConsumptionThe monthly residential consumption of energy in the U.S. for 2012 is found in the following table. Source: Energy Information Administration. Month Energytrillion BTU January 990.527 February 833.163 March 560.826 April 412.426 May 297.500 June 253.015 July 240.486 August 248.035 September 249.354 October 378.094 Number 631.203 December 838.265 Plot the data, letting t=1 correspond to January, t=2 to February, and so on. Is it reasonable to assume that the monthly consumption of energy is periodic? Find the trigonometric function of the form C(t)=asin(bt+c)+d that models these data when t is the month of the year and C(t) is the energy consumption. Graph the function on the same calculator window as the data. Estimate the total energy consumption for the year for residential customers in the United States and compare it to the actual value. Calculate the period of the function found in part b. Is this period reasonable?arrow_forward
 Calculus For The Life SciencesCalculusISBN:9780321964038Author:GREENWELL, Raymond N., RITCHEY, Nathan P., Lial, Margaret L.Publisher:Pearson Addison Wesley,
 Algebra and Trigonometry (MindTap Course List)AlgebraISBN:9781305071742Author:James Stewart, Lothar Redlin, Saleem WatsonPublisher:Cengage Learning
 Glencoe Algebra 1, Student Edition, 9780079039897...AlgebraISBN:9780079039897Author:CarterPublisher:McGraw Hill
 Linear Algebra: A Modern IntroductionAlgebraISBN:9781285463247Author:David PoolePublisher:Cengage Learning
 Holt Mcdougal Larson Pre-algebra: Student Edition...AlgebraISBN:9780547587776Author:HOLT MCDOUGALPublisher:HOLT MCDOUGAL
 Algebra & Trigonometry with Analytic GeometryAlgebraISBN:9781133382119Author:SwokowskiPublisher:Cengage