
Probability and Statistics for Engineering and the Sciences
9th Edition
ISBN: 9781305251809
Author: Jay L. Devore
Publisher: Cengage Learning
expand_more
expand_more
format_list_bulleted
Videos
Textbook Question
Chapter 12, Problem 72SE
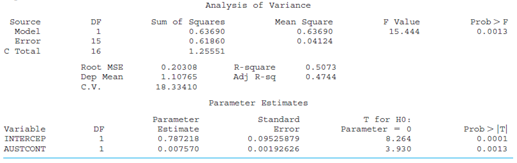
The SAS output at the bottom of this page is based on data from the article “Evidence for and the Rate of Denitrification in the Arabian Sea” (Deep Sea Research, 1978: 431–435). The variables under study are x = salinity level (%) and y = nitrate level (μM/L).
- a. What is the
sample size n? [Hint: Look for degrees of freedom for SSE.] - b. Calculate a point estimate of expected nitrate level when salinity level is 35.5.
- c. Does there appear to be a useful linear relationship between the two variables?
- d. What is the value of the sample
correlation coefficient ? - e. Would you use the simple linear regression model to draw conclusions when the salinity level is 40?
SAS output for Exercise 73
Dependent Variable : ABRLOSS
Expert Solution & Answer
Want to see the full answer?
Check out a sample textbook solution
Students have asked these similar questions
Samples are collected from the River X and pH values are observed. 9 different pH values are
listed in table 3.
Table 3
Concentrations 4.2
Draw box plot and find
a. Bowley's coefficient of skewness
b. Karl Pearson's coefficient of skewness
c. Third moment
3.8
6.0
3.5
8.1
4.9
4.1
3.2
4.0
An article in the Journal of Environmental Engineering (1989, Vol. 115(3), pp.
608–619) reported the results of a study on the occurrence of sodium and chloride in surface
streams in central Rhode Island. The following data are chloride concentration y (in milligrams per
liter) and roadway area in the watershed x (in percentage).
Fifty male subjects drank a measured amount x (in ounces) of a medication and the concentration y
(in percent) in their blood of the active ingredient was measured 30 minutes later. The sample data
are summarized by the following information:
n = 50
Ex = 112.5 Ex? = 356.25
%3D
Ey = 4.83 Ey = 0.667 Exy = 15.255
0 < x < 4.5
Or= 0.875
Or= 0.709
Or= -0.846
Or=0.460
Or= 0.965
Chapter 12 Solutions
Probability and Statistics for Engineering and the Sciences
Ch. 12.1 - The efficiency ratio for a steel specimen immersed...Ch. 12.1 - The article Exhaust Emissions from Four-Stroke...Ch. 12.1 - Bivariate data often arises from the use of two...Ch. 12.1 - The accompanying data on y = ammonium...Ch. 12.1 - The article Objective Measurement of the...Ch. 12.1 - One factor in the development of tennis elbow, a...Ch. 12.1 - The article Some Field Experience in the Use of an...Ch. 12.1 - Referring to Exercise 7, suppose that the standard...Ch. 12.1 - The flow rate y (m3/min) in a device used for...Ch. 12.1 - Suppose the expected cost of a production run is...
Ch. 12.1 - Suppose that in a certain chemical process the...Ch. 12.2 - Refer back to the data in Exercise 4, in which y =...Ch. 12.2 - The accompanying data on y = ammonium...Ch. 12.2 - Refer to the lank temperature-efficiency ratio...Ch. 12.2 - Values of modulus of elasticity (MOE, the ratio of...Ch. 12.2 - The article Characterization of Highway Runoff in...Ch. 12.2 - For the past decade, rubber powder has been used...Ch. 12.2 - For the past decade, rubber powder has been used...Ch. 12.2 - The following data is representative of that...Ch. 12.2 - The bond behavior of reinforcing bars is an...Ch. 12.2 - Wrinkle recovery angle and tensile strength are...Ch. 12.2 - Calcium phosphate cement is gaining increasing...Ch. 12.2 - a. Obtain SSE for the data in Exercise 19 from the...Ch. 12.2 - The invasive diatom species Didymosphenia geminata...Ch. 12.2 - Prob. 25ECh. 12.2 - Show that the point of averages (x,y) lies on the...Ch. 12.2 - Prob. 27ECh. 12.2 - a. Consider the data in Exercise 20. Suppose that...Ch. 12.2 - Consider the following three data sets, in which...Ch. 12.3 - Reconsider the situation described in Exercise 7,...Ch. 12.3 - During oil drilling operations, components of the...Ch. 12.3 - Exercise 16 of Section 12.2 gave data on x =...Ch. 12.3 - During oil drilling operations, components of the...Ch. 12.3 - For the past decade, rubber powder has been used...Ch. 12.3 - Refer back to the data in Exercise 4, in which y =...Ch. 12.3 - Misi (airborne droplets or aerosols) is generated...Ch. 12.3 - Prob. 37ECh. 12.3 - Refer to the data on x = liberation rate and y =...Ch. 12.3 - Carry out the model utility test using the ANOVA...Ch. 12.3 - Prob. 40ECh. 12.3 - Prob. 41ECh. 12.3 - Verify that if each xi is multiplied by a positive...Ch. 12.3 - Prob. 43ECh. 12.4 - Fitting the simple linear regression model to the...Ch. 12.4 - Reconsider the filtration ratemoisture content...Ch. 12.4 - Astringency is the quality in a wine that makes...Ch. 12.4 - The simple linear regression model provides a very...Ch. 12.4 - Prob. 48ECh. 12.4 - You are told that a 95% CI for expected lead...Ch. 12.4 - Prob. 50ECh. 12.4 - Refer to Example 12.12 in which x = test track...Ch. 12.4 - Plasma etching is essential to the fine-line...Ch. 12.4 - Consider the following four intervals based on the...Ch. 12.4 - The height of a patient is useful for a variety of...Ch. 12.4 - Prob. 55ECh. 12.4 - The article Bone Density and Insertion Torque as...Ch. 12.5 - The article Behavioural Effects of Mobile...Ch. 12.5 - The Turbine Oil Oxidation Test (TOST) and the...Ch. 12.5 - Toughness and fibrousness of asparagus are major...Ch. 12.5 - Head movement evaluations are important because...Ch. 12.5 - Prob. 61ECh. 12.5 - Prob. 62ECh. 12.5 - Prob. 63ECh. 12.5 - The accompanying data on x = UV transparency index...Ch. 12.5 - Torsion during hip external rotation and extension...Ch. 12.5 - Prob. 66ECh. 12.5 - Prob. 67ECh. 12 - The appraisal of a warehouse can appear...Ch. 12 - Prob. 69SECh. 12 - Forensic scientists are often interested in making...Ch. 12 - Phenolic compounds are found in the effluents of...Ch. 12 - The SAS output at the bottom of this page is based...Ch. 12 - The presence of hard alloy carbides in high...Ch. 12 - The accompanying data was read from a scatterplot...Ch. 12 - An investigation was carried out to study the...Ch. 12 - Prob. 76SECh. 12 - Open water oil spills can wreak terrible...Ch. 12 - In Section 12.4, we presented a formula for...Ch. 12 - Show that SSE=Syy1Sxy, which gives an alternative...Ch. 12 - Suppose that x and y are positive variables and...Ch. 12 - Let sx and sy denote the sample standard...Ch. 12 - Verify that the t statistic for testing H0: 1 = 0...Ch. 12 - Use the formula for computing SSE to verify that...Ch. 12 - In biofiltration of wastewater, air discharged...Ch. 12 - Normal hatchery processes in aquaculture...Ch. 12 - Prob. 86SECh. 12 - Prob. 87SE
Knowledge Booster


Learn more about
Need a deep-dive on the concept behind this application? Look no further. Learn more about this topic, statistics and related others by exploring similar questions and additional content below.Similar questions
- Han Samples are collected from the River X and pH values are observed. 9 different pH values are listed in table 3. Table 3 Concentrations 4.2 3.8 6.0 3.5 8.1 4.9 4.1 3.2 4.0Draw box plot and find a. Bowley’s coefficient of skewness b. Karl Pearson’s coefficient of skewness c. Third momentarrow_forwardFollowing are measurements of soil concentrations (in mg /kg) of chromium (Cr) and nickel (Ni) at20 sites in the area of Cleveland, Ohio. These data are taken from the article "Variation in NorthAmerican Regulatory Guidance for Heavy Metal Surface Soil Contamination at Commercial andIndustrial Sites" (A. Jennings and J. Ma, J. Environment Eng, 2007:587-609). Cr: 260 19 36 247 263 319 317 277 319 264 23 29 61 119 33 281 21 35 64 30Ni: 435 377 359 53 38 38 54 188 397 33 92 490 28 35 799 347 321 32 74 508 (a) Construct a histogram for each set of concentrations. (b) Find the 1st, 2nd and 3rd quartiles for the Cr concentrations (c) Find the 1st, 2nd and 3rd quartiles for the Ni concentrations.arrow_forwardA sociologist wants to determine if the life expectancy of people in Africa is less than the life expectancy of people in Asia. The data obtained is shown in the table below. Africa Asia = 63.3 yr. 1 X,=65.2 yr. 2 o, = 9.1 yr. = 7.3 yr. n1 = 120 = 150arrow_forward
- 2. Two kinds of bumper guards, six of each kind, were mounted on a certain make of compact car. Each car was then run into a concrete wall at 5 miles per hour and the costs of repairs (in dollars) was recorded. Summary of the data is shown below. n = 6 i = 144 si = 363.20 n =6 i = 149 si = 202.00 Test at the 0.02 level of significance whether it is reasonable to assume that the two populations sampled have equal variances.arrow_forwardTwo different analytical methods were used to determine residual chlorine in sewage effluents. Both methods were used on the same samples, but each sample came from various locations with differing amounts of contact time with the effluent. Two methods were used to determine the concentration of Cl in mg/L, and the results are shown in the attached table. A. What type of t test should be used to compare the two methods and why? B. Do the two methods give different results? State and test the appropriatehypotheses at 95% confidence level. C. Does the conclusion depend on whether the 90%, 95%, or 99% confidence levelsare used?arrow_forwardAn article in the Fire Safety Journal (“The Effect of Nozzle Design on the Stability and Performance of Turbulent Water Jets,” Vol. 4, August 1981) describes an experiment in which a shape factor was determined for several different nozzle designs at six levels of jet efflux velocity. Interest focused on potential differences between nozzle designs (blocks), with velocity considered as a nuisance variable. The data are shown below: Jet Efflux Velocity (m/s) Nozzle Design 11.73 14.37 16.59 20.43 23.46 28.74 1 0.78 0.80 0.81 0.75 0.77 0.78 2 0.85 0.85 0.92 0.86 0.81 0.83 3 0.93 0.92 0.95 0.89 0.89 0.83 4 1.14 0.97 0.98 0.88 0.86 0.83 5 0.97 0.86 0.78 0.76 0.76 0.75 1) Write the null hypothesis and the alternative hypothesis (for the factor). 2) Find the ANOVA table. (round to five decimal places). 3) What is your decision about the null hypothesis, consider ?. 4) If your decision in part (4) was reject , perform Tukey test to determine which pairwise means are…arrow_forward
- The average life expectancy of tires 40,000 miles. The company has rece The manager hopes to find out wheth life test, 40 tires were used, and their following SPSS results: One-Sample Statistics Std. Dev Mean time 40881.8262 40 2945 One- df Sig. (2-taile 1.893 Set up Ho: M = 40,000 %3D HA: The test statistic is 1.893 The distribution of the test stati Make the statistical decision (o Express the statistical decisionarrow_forwardPlease show your work. Thank you.An experiment was conducted to investigate the effects of the concentrations of sulfuric acid (H2SO4) and calcium chloride (CaCl2) on the amount of black mud precipitate in the treatment of alkaline wastewater. There were three levels of each concentration, and two replicates of the experiment were made at each combination of levels. The relevant statistical analysis is provided in the following table: (image) a) Does there appear to be an interaction between concentration of sulfuric acid and calcium chloride at the .05 level? What does this say about the additive model? b) Can the effect of concentration of sulfuric acid on amount of black mud precipitate in the treatment of alkaline wastewater be described by interpreting the main effects of concentration of sulfuric acid? If so, interpret the main effects at the .05 level, including the appropriate test statistic and p-value. If not, explain why not.c) Can the effect of concentration of calcium…arrow_forwardThe following data are from an experiment on carnations. The explanatory variable is the amount of inorganic bromine (micrograms per milliliter) in a plot of standard size. The response variable is the average number of flowers per carnation plant for the 30 plants grown in the plot. Find the change in number of flowers per plant given an increase in 1 µg per mL of inorganic bromine. Amount of bromine Average no. of flowers Select one: O a. -0.216 O b. 0.216 O c. O d. -3.81 4.04 3 3.2 4 2.9 6 3.7 7 2.2 8 1.8 10 2.3 12 1.7 15 16 0.8 0.3arrow_forward
arrow_back_ios
arrow_forward_ios
Recommended textbooks for you
 Calculus For The Life SciencesCalculusISBN:9780321964038Author:GREENWELL, Raymond N., RITCHEY, Nathan P., Lial, Margaret L.Publisher:Pearson Addison Wesley,
 Glencoe Algebra 1, Student Edition, 9780079039897...AlgebraISBN:9780079039897Author:CarterPublisher:McGraw Hill
Calculus For The Life Sciences
Calculus
ISBN:9780321964038
Author:GREENWELL, Raymond N., RITCHEY, Nathan P., Lial, Margaret L.
Publisher:Pearson Addison Wesley,
Glencoe Algebra 1, Student Edition, 9780079039897...
Algebra
ISBN:9780079039897
Author:Carter
Publisher:McGraw Hill
F- Test or F- statistic (F- Test of Equality of Variance); Author: Prof. Arvind Kumar Sing;https://www.youtube.com/watch?v=PdUt7InTyc8;License: Standard Youtube License
Statistics 101: F-ratio Test for Two Equal Variances; Author: Brandon Foltz;https://www.youtube.com/watch?v=UWQO4gX7-lE;License: Standard YouTube License, CC-BY
Hypothesis Testing and Confidence Intervals (FRM Part 1 – Book 2 – Chapter 5); Author: Analystprep;https://www.youtube.com/watch?v=vth3yZIUlGQ;License: Standard YouTube License, CC-BY
Understanding the Levene's Test for Equality of Variances in SPSS; Author: Dr. Todd Grande;https://www.youtube.com/watch?v=udJr8V2P8Xo;License: Standard Youtube License