Videos
(a)
To graph: The plot
(a)
Explanation of Solution
Given: The value of
Graph: The plot is drawn by following these steps:
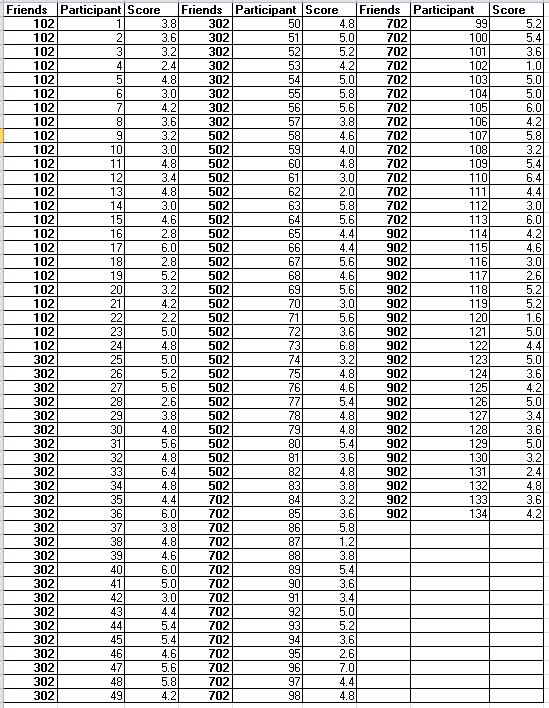
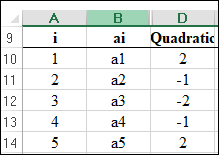
Step 1: Open Excel sheet and write the data value for
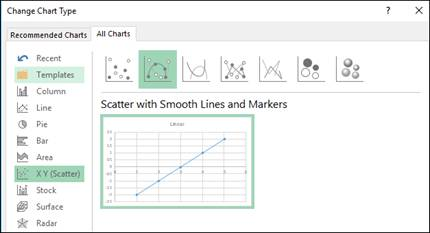
Step 2: INSERT > Recommended Charts > All Charts > Line Chart. The screenshot is shown below:
The plot is obtained as shown below:
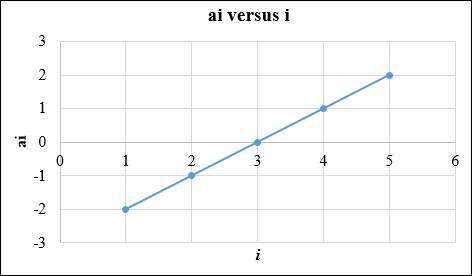
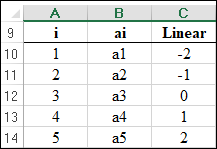
The values chosen for
The contrast can be calculated by the sum of weighted means. If
Interpretation: The value of
(b)
To graph: The plot
(b)
Explanation of Solution
Graph: The plot is drawn by following these steps:
Step 1: Open Excel sheet and write the data value for
Step 2: INSERT > Recommended Charts > All Charts > Line Chart. The screenshot is shown below:
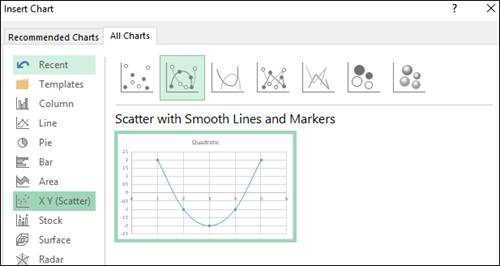
The plot is obtained as shown below:
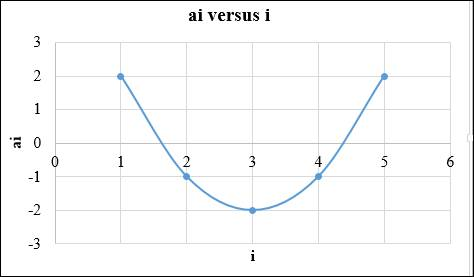
The contrast can be calculated by the sum of weighted means. If
The contrast for means
Interpretation: The value chosen,
(c)
To test: The hypotheses for the linear, quadratic, and cubic trend.
(c)
Answer to Problem 68E
Solution: The P-values are less than 0
Explanation of Solution
Calculation: To test the null hypothesis, steps are as follows:
Contrasts for the linear trend can be calculated as:
Contrasts for the quadratic trend can be calculated as:
Contrasts for the cubic trend can be calculated as:
The pooled standard deviation is obtained as:
The standard error of linear contrast can be calculated as:
The standard error of quadratic contrast can be calculated as:
The standard error of cubic contrast can be calculated as:
The resultant t statistic values for the linear trend can be calculated as:
The resultant t- statistic values for the quadratic trend can be calculated as:
The resultant t- statistic values for the cubic trend can be calculated as:
The resultant P- values are obtained by using the standard normal distribution table as follows:
Conclusion: The P-values is less than 0
Want to see more full solutions like this?
Chapter 12 Solutions
Introduction to the Practice of Statistics 9E & LaunchPad for Introduction to the Practice of Statistics 9E (Twelve-Month Access)


 MATLAB: An Introduction with ApplicationsStatisticsISBN:9781119256830Author:Amos GilatPublisher:John Wiley & Sons Inc
 Probability and Statistics for Engineering and th...StatisticsISBN:9781305251809Author:Jay L. DevorePublisher:Cengage Learning
 Statistics for The Behavioral Sciences (MindTap C...StatisticsISBN:9781305504912Author:Frederick J Gravetter, Larry B. WallnauPublisher:Cengage Learning
 Elementary Statistics: Picturing the World (7th E...StatisticsISBN:9780134683416Author:Ron Larson, Betsy FarberPublisher:PEARSON
 The Basic Practice of StatisticsStatisticsISBN:9781319042578Author:David S. Moore, William I. Notz, Michael A. FlignerPublisher:W. H. Freeman
 Introduction to the Practice of StatisticsStatisticsISBN:9781319013387Author:David S. Moore, George P. McCabe, Bruce A. CraigPublisher:W. H. Freeman