
Probability and Statistics for Engineering and the Sciences
9th Edition
ISBN: 9781305251809
Author: Jay L. Devore
Publisher: Cengage Learning
expand_more
expand_more
format_list_bulleted
Videos
Textbook Question
Chapter 1.2, Problem 16E
The article cited in Example 1.2 also gave the accompanying strength observations for cylinders:
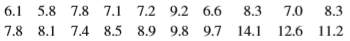
- a. Construct a comparative stem-and-leaf display (see the previous exercise) of the beam and cylinder data, and then answer the questions in parts (b)-(d) of Exercise 10 for the observations on cylinders.
- b. In what ways are the two sides of the display similar? Are there any obvious differences between the beam observations and the cylinder observations?
- c. Construct a dotplot of the cylinder data.
Expert Solution & Answer

Trending nowThis is a popular solution!

Students have asked these similar questions
Use excel to show formulas
1.Determine the center of gravity for the following destinations and shipping quantities:
Destination (x,y) Quantity
A (3,3) 400
B (2,5) 800
C (3,7) 600
D (1,4) 300
2)The manager for a contractual ride-share company wants to construct a control chart for determining whether 10-drivers are under control with regard to the number of complaints filed. Accordingly, the manager sampled 100 reviews from last year for each driver, with the following results:
Driver Number of Complaints
1 8
2 18
3 21
4…
Which model—the one for parliaments or the one for ministries (or cabinets)—presented in the article has the greater explanatory power? How can you tell?
Two refreshment stands kept track of the number of cases of soda they sold
weekly during the summer time, as shown on the dot plots below.
Stand A
Stand B
10 11 12 13 14 15 16 17 18 19
10 11 12 13 14 15 16 17 18 19
Number of Cases Sold
Number of Cases Sold
What is the difference between the modes of the number of cases of soda sold?
OA. 11
ов. 2
ос. 5
OD. 16
Chapter 1 Solutions
Probability and Statistics for Engineering and the Sciences
Ch. 1.1 - Give one possible sample of size 4 from each of...Ch. 1.1 - For each of the following hypothetical...Ch. 1.1 - Consider the population consisting of all...Ch. 1.1 - a. Give three different examples of concrete...Ch. 1.1 - Many universities and colleges have instituted...Ch. 1.1 - The California State University (CSU) system...Ch. 1.1 - A certain city divides naturally into ten district...Ch. 1.1 - The amount of flow through a solenoid valve in an...Ch. 1.1 - In a famous experiment carried out in 1882,...Ch. 1.2 - Consider the strength data for beams given in...
Ch. 1.2 - The accompanying specific gravity values for...Ch. 1.2 - The accompanying summary data on CeO2 particle...Ch. 1.2 - Allowable mechanical properties for structural...Ch. 1.2 - The accompanying data set consists of observations...Ch. 1.2 - Do running limes of American movies differ somehow...Ch. 1.2 - The article cited in Example 1.2 also gave the...Ch. 1.2 - The accompanying data came from a study of...Ch. 1.2 - Every corporation has a governing board of...Ch. 1.2 - The number of contaminating particles on a silicon...Ch. 1.2 - The article Determination of Most Representative...Ch. 1.2 - The article cited in Exercise 20 also gave the...Ch. 1.2 - How does the speed of a runner vary over the...Ch. 1.2 - The article Statistical Modeling of the Time...Ch. 1.2 - The accompanying data set consists of observations...Ch. 1.2 - A transformation of data values by means of some...Ch. 1.2 - The accompanying summary data on CeO2 particle...Ch. 1.2 - The article Study on the Life Distribution of...Ch. 1.2 - The accompanying frequency distribution on...Ch. 1.2 - The following categories for type of physical...Ch. 1.2 - A Pareto diagram is a variation of a histogram for...Ch. 1.2 - The cumulative frequency and cumulative relative...Ch. 1.2 - Fire load (MJ/m2) is the heat energy that could be...Ch. 1.3 - The May 1, 2009, issue of The Montclarian reported...Ch. 1.3 - Exposure to microbial products, especially...Ch. 1.3 - Mercury is a persistent and dispersive...Ch. 1.3 - A sample of 26 offshore oil workers took part in a...Ch. 1.3 - The article Snow Cover and Temperature...Ch. 1.3 - Blood pressure values are often reported to the...Ch. 1.3 - The propagation of fatigue cracks in various...Ch. 1.3 - Compute the sample median. 25% trimmed mean. 10%...Ch. 1.3 - A sample of n = 10 automobiles was selected, and...Ch. 1.3 - a. If a constant c is added to each xi in a...Ch. 1.3 - An experiment to study the lifetime (in hours) for...Ch. 1.4 - Poly(3-hydroxybutyrate) (PHB), a semicrystalline...Ch. 1.4 - The value of Youngs modulus (GPa) was determined...Ch. 1.4 - The article Effects of Short-Term Warming on Low...Ch. 1.4 - Zinfandel is a popular red wine varietal produced...Ch. 1.4 - Exercise 34 presented the following data on...Ch. 1.4 - A study of the relationship between age and...Ch. 1.4 - In 1997 a woman sued a computer keyboard...Ch. 1.4 - The article A Thin-Film Oxygen Uptake Test for the...Ch. 1.4 - The first four deviations from the mean in a...Ch. 1.4 - A mutual fund is a professionally managed...Ch. 1.4 - Grip is applied to produce normal surface forces...Ch. 1.4 - Here is a stem-and-leaf display of the escape time...Ch. 1.4 - The following data on distilled alcohol content...Ch. 1.4 - A sample of 20 glass bottles of a particular type...Ch. 1.4 - A company utilizes two different machines to...Ch. 1.4 - Blood cocaine concentration (mg/L) was determined...Ch. 1.4 - Observations on burst strength (lb/in2) were...Ch. 1.4 - The accompanying comparative boxplot of gasoline...Ch. 1 - Consider the following information on ultimate...Ch. 1 - A sample of 77 individuals working at a particular...Ch. 1 - Fretting is a wear process that results from...Ch. 1 - The accompanying frequency distribution of...Ch. 1 - A deficiency of the (race element selenium in the...Ch. 1 - Aortic stenosis refers to a narrowing of the...Ch. 1 - a. For what value of c is the quantity (xi c)2...Ch. 1 - a. Let a and b be constants and let yi = axi + b...Ch. 1 - Elevated energy consumption during exercise...Ch. 1 - Here is a description from Minitab of the strength...Ch. 1 - Anxiety disorders and symptoms can often be...Ch. 1 - The article Can We Really Walk Straight? (Amer. J....Ch. 1 - The mode of a numerical data set is the value that...Ch. 1 - Specimens of three different types of rope wire...Ch. 1 - The three measures of center introduced in this...Ch. 1 - The authors of the article Predictive Model for...Ch. 1 - Consider a sample x1 , x2,..., xn and suppose that...Ch. 1 - Let xn and sn2 denote the sample mean and variance...Ch. 1 - Lengths of bus routes for any particular transit...Ch. 1 - A study carried out to investigate the...Ch. 1 - Prob. 82SECh. 1 - Prob. 83SECh. 1 - Consider a sample x1, ... , xn with n even. Let xL...
Knowledge Booster


Learn more about
Need a deep-dive on the concept behind this application? Look no further. Learn more about this topic, statistics and related others by exploring similar questions and additional content below.Similar questions
- Can people tell the difference between a female nose and a male nose? This research question was examined in an article. Eight Caucasian males and eight Caucasian females posed for nose photos. The article states that none of the volunteers wore nose studs or had prominent nasal hair. Each person placed a black Lycra tube over his or her head in such a way that only the nose protruded through a hole in the material. Photos were then taken from three different angles: front view, three-quarter view, and profile. These photos were shown to a sample of undergraduate students. Each student in the sample was shown one of the nose photos and asked whether it was a photo of a male or a female. The response was then classified as either correct or incorrect. The following table was constructed using summary values reported in the article. Sex ID View Front Profile Three-Quarter Correct 29 26 23 Incorrect 11 14 17 Is there evidence that the proportion of correct sex…arrow_forwardRegarding the five-number summary: a. Identify its components.b. How can it be employed to describe center and variation?c. What graphical display is based on it?arrow_forward3. Load the Santa Barbara temperature data using the following com- mands stbarb=read.table ("berkeley.dat")[,3] Since the data is non-stationary, we consider taking difference of stbarb. Create ACF and PACF plots for the differenced data. Do you have an opinion on possible models based only on these plots?arrow_forward
- Use the data provided on Canvas. In automotive assembly processes, automation cannot always guarantee the dimensional accuracy of a car assembly as required by the design specification. Thus, some skillful workers will visually inspect those assembled car bodies and conduct manual adjustments when necessary. These workers are called "Fitter" in the automotive industry. This scenario is illustrated in the followingarrow_forwardFor items 11 to 14: A study was conducted to investigate the interactions between California sheephead, macroalgae, and urchins. The output path diagram of the study is given below: sheephea biomas urchin density kelp stipe density fleshy alga cover rustose coraline gan For items 12 to 14: Identify the type of effect component that exists between each pair of variables: 13. urchin density and crustose coralline algae O A. direct O B. indirect O C. spurious O D. unanalyzed < O Oarrow_forwardHead movement evaluations are important because disabled individuals may be able to operate communications aids using head motion. A paper reported the accompanying data on neck rotation (in degrees) for 14 subjects both in the clockwise direction (CL) and in the counterclockwise direction (CO). For purposes of this exercise, you can assume that the 14 subjects are representative of the population of adult Americans. Subject: 1 CL: Find the df. df = CO: 2 3 44.3 52.1 4 5 6 57.1 35.7 54.5 56.8 51.1 70.8 7 Find the test statistic. (Round your answer to two decimal places.) t = 8 77.3 51.6 60.2 52.7 47.2 65.6 71.4 48.8 Use technology to find the P-value. (Round your answer to four decimal places.) P-value = 9 54.7 53.1 10 11 12 13 14 Based on these data, is it reasonable to conclude that mean neck rotation is greater in the clockwise direction than in the counterclockwise direction? Carry out a hypothesis test using a significance level of 0.01. (Use CL - μCO.) 63.6 59.2 59.2 55.8 38.7…arrow_forward
- May you draw a model ?arrow_forwardFor the (x, y) pairs of data points (10, 8.04), (8, 6.95), (13, 7.58), (9, 8.81), (11, 8.33), (14, 9.96), (6, 7.23), (4, 4.26) and (12, 10.84), the value of cov(x, y) is اختر أحد الخيارات a. 6.679 O b. 4.925 O C. 9.667 O d. 8.000 Oarrow_forwardIn an experiment to assess the effect of the angle of pull on the force required to cause separation in electrical connectors, four different angles (factor A) were used, and each of a sample of five connectors (factor B) was pulled once at each angle. The data appears in the accompanying table. A 0° 20 4° 6° Ho: B1 = B₂ = ß3 =B4 = ß5 = 0 H₂: no B₁ = 0 Source ⒸH₂: α₁ = α₂ = x3 = α4 = 0 H₂: no α₁ = 0 0 Ho: a1 = 02 = az = 04 = 0 H: at least one a, # 0 A B Error Total 1 45.2 44.3 42.5 43.9 Does the data suggest that true average separation force is affected by the angle of pull? State the appropriate hypotheses. Ho: P₁ = B₂ = B3 =B4 = ß5 = 0 H₂: at least one ß, * 0 df 2 42.2 44.5 42.5 45.9 Test the hypotheses at level 0.01 by first constructing an ANOVA table (SST= 397.02, SSA= 54.44, and SSB 250.80). (Round your answers to two decimal places.) F0.01 SS B 3 39.7 38.5 42.5 47.6 MS 4 36.7 38.0 42.4 37.5 f 5 45.8 47.5 48.7 56.3 State the conclusion in the problem context. Reject H. The data…arrow_forward
- # i) 2.76: Insect Weights Consider a dataset giving the adult weight of species of insects. Most species of insects weigh less than 5 grams, but there are a few species that weigh a great deal, including the largest insect known: the rare and endangered Giant Weta from New Zealand, which can weigh as much as 71 grams. Describe the shape of the distribution of weights of insects. Is it symmetric or skewed? If it is skewed, is it skewed to the left or skewed to the right? Which will be larger, the mean or the median? # ii) 2.87: (Make up your own data set. Do not give the same answer as in the book!!) # Create a Dataset Give any set of five numbers satisfying the condition that: # a) The mean of the numbers is substantially less than the median. # b) The mean of the numbers is substantially more than the median. # c) The mean and the median are equal.arrow_forwardResearchers conducted a study to learn how early childhood education relates to a child's future earning potential. They gathered a random sample of 200 5-year-old children and divided them into two groups. Children who had preschool education were gathered into the first group. All other children were placed in the second group. By age 30, the subjects who received preschool education were 80% less likely to have received welfare in their 20s. Part A: This study was Select an answer Part B: Having a preschool education (yes or no) was one variable in this study. Which is it? Response Explanatory Part C: Receiving welfare in one's 20s (yes or no) was another variable in this study. Which is it? Explanatory Response Part D: Can researchers conclude from this study that preschool education causes people to be less likely to receive welfare in their 20s? Yes Noarrow_forwardA team of researchers analyzed the meat from each in a sample of 17 "red snapper" fish fillets purchased from vendors across region in an effort estimate the true proportion of fillets that are really red snapper. DNA tests revealed that 5 of the 17 fillets (or 29%) were not red snapper but the cheaper look-alike variety of fish. Complete parts a through d. a. Identify the parameter of interest to the researchers. The parameter of interest is the of fish fillets that are actually red snapper. b. Explain why a large-sample confidence interval is inappropriate to apply in this study. Choose the correct answer below. OA. It is inappropriate because either the number of successes in the sample or the number of failures in the sample is less than 15. OB. It is inappropriate because the sampling distribution is approximately normal. OC. It is inappropriate because the expected probability of success is 0.29. OD. It is inappropriate because either the number of successes in the sample or the…arrow_forward
arrow_back_ios
SEE MORE QUESTIONS
arrow_forward_ios
Recommended textbooks for you
 MATLAB: An Introduction with ApplicationsStatisticsISBN:9781119256830Author:Amos GilatPublisher:John Wiley & Sons Inc
 Probability and Statistics for Engineering and th...StatisticsISBN:9781305251809Author:Jay L. DevorePublisher:Cengage Learning
 Statistics for The Behavioral Sciences (MindTap C...StatisticsISBN:9781305504912Author:Frederick J Gravetter, Larry B. WallnauPublisher:Cengage Learning
 Elementary Statistics: Picturing the World (7th E...StatisticsISBN:9780134683416Author:Ron Larson, Betsy FarberPublisher:PEARSON
 The Basic Practice of StatisticsStatisticsISBN:9781319042578Author:David S. Moore, William I. Notz, Michael A. FlignerPublisher:W. H. Freeman
 Introduction to the Practice of StatisticsStatisticsISBN:9781319013387Author:David S. Moore, George P. McCabe, Bruce A. CraigPublisher:W. H. Freeman
MATLAB: An Introduction with Applications
Statistics
ISBN:9781119256830
Author:Amos Gilat
Publisher:John Wiley & Sons Inc
Probability and Statistics for Engineering and th...
Statistics
ISBN:9781305251809
Author:Jay L. Devore
Publisher:Cengage Learning
Statistics for The Behavioral Sciences (MindTap C...
Statistics
ISBN:9781305504912
Author:Frederick J Gravetter, Larry B. Wallnau
Publisher:Cengage Learning
Elementary Statistics: Picturing the World (7th E...
Statistics
ISBN:9780134683416
Author:Ron Larson, Betsy Farber
Publisher:PEARSON
The Basic Practice of Statistics
Statistics
ISBN:9781319042578
Author:David S. Moore, William I. Notz, Michael A. Fligner
Publisher:W. H. Freeman
Introduction to the Practice of Statistics
Statistics
ISBN:9781319013387
Author:David S. Moore, George P. McCabe, Bruce A. Craig
Publisher:W. H. Freeman
Hypothesis Testing using Confidence Interval Approach; Author: BUM2413 Applied Statistics UMP;https://www.youtube.com/watch?v=Hq1l3e9pLyY;License: Standard YouTube License, CC-BY
Hypothesis Testing - Difference of Two Means - Student's -Distribution & Normal Distribution; Author: The Organic Chemistry Tutor;https://www.youtube.com/watch?v=UcZwyzwWU7o;License: Standard Youtube License