The majority of American adults use their smartphones to go online. The bar graph shows the percentage of American using phones to go online from 2009 through 2013. Source: Pew Internet and American Life Project The data in the graph can be modeled by the formula S = 32 + 8.7 x − 0.3 x 2 , where S represents the percentage of American adults using smartphones to go online x years after 2009. Use this formula to solve Exercises 93 –94 . According to the formula, what percentage of American adults used smartphones to go online in 2013? Does this underestimate or overestimate the actual percent shown by the bar graph? By how much? The formula C = 5 9 ( F − 32 )
The majority of American adults use their smartphones to go online. The bar graph shows the percentage of American using phones to go online from 2009 through 2013. Source: Pew Internet and American Life Project The data in the graph can be modeled by the formula S = 32 + 8.7 x − 0.3 x 2 , where S represents the percentage of American adults using smartphones to go online x years after 2009. Use this formula to solve Exercises 93 –94 . According to the formula, what percentage of American adults used smartphones to go online in 2013? Does this underestimate or overestimate the actual percent shown by the bar graph? By how much? The formula C = 5 9 ( F − 32 )
Solution Summary: The author calculates the percentage of American adults who used smart phones to go online in 2012 according to the formula.
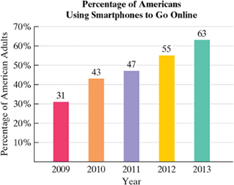
The majority of American adults use their smartphones to go online. The bar graph shows the percentage of American using phones to go online from 2009 through 2013.
Source: Pew Internet and American Life Project
The data in the graph can be modeled by the formula
S
=
32
+
8.7
x
−
0.3
x
2
,
where S represents the percentage of American adults using smartphones to go online x years after 2009. Use this formula to solveExercises 93 –94.
According to the formula, what percentage of American adults used smartphones to go online in 2013? Does this underestimate or overestimate the actual percent shown by the bar graph? By how much?
America is getting older. The graph shows the projected elderly U.S. population for ages 65–84 and for ages 85 and older.The formula E = 5.8√x + 56.4 models the projected number of elderly Americans ages 65–84, E, in millions, x years after 2020.a. Use the formula to find the projected increase in the number of Americans ages 65–84, in millions, from 2030 to 2060. Express this difference in simplified radicalform.b. Use a calculator and write your answer in part (a) to the nearest tenth. Does this rounded decimal overestimate or underestimate the difference in the projected data shown by the bar graph ? By how much?
For Exercises 49–52, rewrite the equation so that the coefficient on x is positive.
In Exercises 1–6, solve for x.
Chapter 1 Solutions
Intermediate Algebra for College Students (7th Edition)
Need a deep-dive on the concept behind this application? Look no further. Learn more about this topic, algebra and related others by exploring similar questions and additional content below.


 Algebra: Structure And Method, Book 1AlgebraISBN:9780395977224Author:Richard G. Brown, Mary P. Dolciani, Robert H. Sorgenfrey, William L. ColePublisher:McDougal Littell