Data Analytics For Accounting
19th Edition
ISBN: 9781260375190
Author: RICHARDSON, Vernon J., Teeter, Ryan, Terrell, Katie
Publisher: Mcgraw-hill Education,
expand_more
expand_more
format_list_bulleted
Question
Chapter 1, Problem 4P
To determine
Do an Excel PivotTable according to state and find out the number of rejected applications for each state. Reorder the numbers and draw a graph ordering the states and the number of rejected loans from highest to lowest. Identify whether there exist any variations among states.
Expert Solution & Answer
Explanation of Solution
The number of rejected applications for each state is as follows:
| Row Labels | Count of Loan Title |
| CA | 99,792 |
| TX | 62,049 |
| NY | 60,718 |
| FL | 60,051 |
| PA | 33,167 |
| IL | 31,488 |
| GA | 29,000 |
| OH | 28,510 |
| NJ | 27,666 |
| VA | 23,556 |
| MI | 20,696 |
| NC | 20,386 |
| MA | 18,808 |
| MD | 17,856 |
| AZ | 16,281 |
| MO | 14,605 |
| WA | 14,007 |
| CO | 13,335 |
| AL | 13,185 |
| SC | 12,146 |
| CT | 12,137 |
| LA | 11,181 |
| WI | 10,664 |
| MN | 10,400 |
| KY | 10,286 |
| NV | 9,513 |
| 9,400 | |
| OK | 8,165 |
| OR | 7,198 |
| KS | 6,336 |
| UT | 5,126 |
| WV | 4,975 |
| HI | 4,341 |
| NM | 4,329 |
| NH | 4,038 |
| RI | 3,637 |
| DE | 2,708 |
| MT | 2,102 |
| AK | 2,005 |
| DC | 1,900 |
| VT | 1,829 |
| SD | 1,620 |
| WY | 1,608 |
| IN | 1,134 |
| MS | 551 |
| TN | 449 |
| NE | 175 |
| IA | 144 |
| ME | 108 |
| ID | 69 |
| ND | 38 |
| (blank) | 21 |
| Grand Total | 755,489 |
The graph ordering the states and the number of rejected loans from highest to lowest:
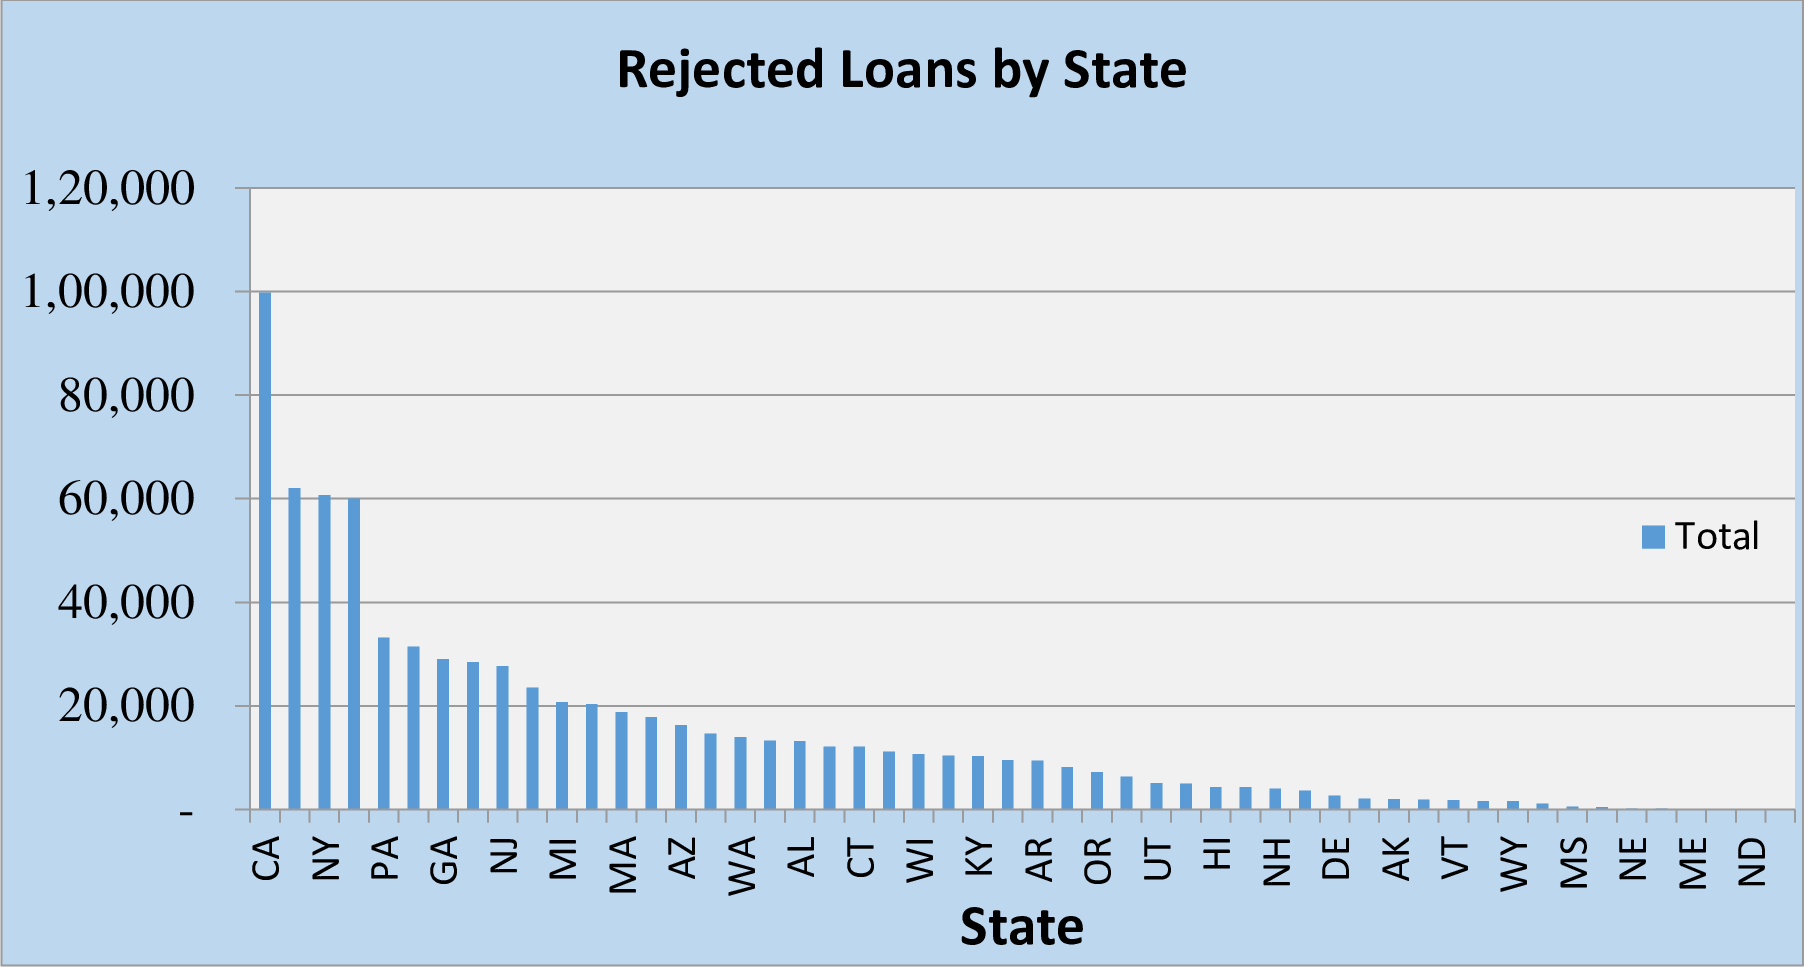
There is a varaibility among the number of loans rejected in a particular state and the population of that state. The number of rejected loans varies in a different manner.
Want to see more full solutions like this?
Subscribe now to access step-by-step solutions to millions of textbook problems written by subject matter experts!
Students have asked these similar questions
Consider the 2013 rejected loan data from LendingClub titled "DAA Chapter 1-2 Data." Similar to the analysis done in the chapter, let's
scrub the employment length. Because our analysis requires risk scores, debt-to-income data, and employment length, we need to
make sure each of them has valid data.
a.Sort the file based on employment length and remove those observations (the complete row or record) that have a missing score
("NA"). Note that we are including the employment lengths of zero, different than the analysis in the chapter text.
b. Sort the file based on debt-to-income and remove those observations (the complete row or record) that have a missing score, a
score of zero, or a negative score, similar to that done in Problem 10.
c. Sort the file based on risk score and remove those observations (the complete row or record) that have a missing score or a score
of zero, similar to that done in Problem 9.
d. There should now be 669,993 observations. Any thoughts on what biases are…
Please model the following decision in a spreadsheet, optimize it using MS-Excel Solver, and then upload that spreadsheet by attaching it to this
question. I will grade this question on the accuracy of your () spreadsheet model (decision variables, objective, and constraints), (i) Solver
parameters, (i optimal solution. Partial credit is available.
The personnel-planning problem of Lexington Bank. The main branch of Lexington Bank is open for retail business from 8:00 AM to
4:00 PM on weekdays. The staffing requires from 8 to 15 tellers on duty depending on the time of day, as indicated in the following table.
Time Period
Minimum No. of Tellers
8:00 AM - 10:00 AM
10:00 AM - 12:00 PM
12:00 PM - 2:00 PM
10
15
2:00 PM - 4:00 PM
12
Full-time tellers work 8 consecutive hours (from 8:00 AM to 4:00 PM) at $15 per hour. Part-time workers work 4 consecutive hours at $8
per hour starting at 8:00 AM, 10:00 AM, or 12:00 noon. Assume workers never take breaks. Union regulations require that all…
Part of your job is to review customer requests for credit. You have three new credit applications on your desk and part of your analysis requires that the current ratlos and quick ratlos be compared.
Chapter 1 Solutions
Data Analytics For Accounting
Ch. 1 - Prob. 1MCQCh. 1 - Prob. 2MCQCh. 1 - Prob. 3MCQCh. 1 - Prob. 4MCQCh. 1 - Prob. 5MCQCh. 1 - Prob. 6MCQCh. 1 - Prob. 7MCQCh. 1 - Prob. 8MCQCh. 1 - Prob. 9MCQCh. 1 - Prob. 10MCQ
Ch. 1 - Prob. 1DQCh. 1 - Give an example of how Data Analytics creates...Ch. 1 - Prob. 3DQCh. 1 - Prob. 4DQCh. 1 - Prob. 5DQCh. 1 - Prob. 6DQCh. 1 - Prob. 7DQCh. 1 - Prob. 8DQCh. 1 - Prob. 9DQCh. 1 - Prob. 10DQCh. 1 - Prob. 11DQCh. 1 - Prob. 12DQCh. 1 - To address the question Will I receive a loan from...Ch. 1 - Download and consider the data dictionary file...Ch. 1 - Download and consider the rejected loans dataset...Ch. 1 - Prob. 3PCh. 1 - Prob. 4PCh. 1 - Consider the 2013 declined loan data from...Ch. 1 - Consider the 2013 declined loan data from...
Knowledge Booster

Similar questions
- Write a paragraph on each of the following topics: liquidity, asset management, debt management and profitability. Be sure to label these separately. Analyze each topic using the answers from your ratios to support your analysis by deciphering what they are telling you. Create a text box (Insert Menu, click on the “Text” button on the right side of the menu bar, and choose, “Text box”. Then click and drag a box to write in.arrow_forwardI need help with this worksheet that calculates whether or not leasing or purchasing a vehicle is a better option. I have attached a sample from our reading along with a screenshot of the spreadsheet that we are to work on. Can I get an explanation for how this is calculated?arrow_forwardUse the assumptions below to create calculations to determine annual and monthly revenue projections for each of the categories. Be sure to make the revenue category on the pro-forma view (above) descriptive and use your assumptions as drivers for the values calculated. Make it easy to change the assumptions to determine the impact of a change (up or down) in volume, rates and discounts. Insert lines or columns as needed. Camps and Schools require physicals before kids arrive. There are 150 camper physicals spread evenly in May and June. There are 500 school physicals, 25% in July, 65% in August, and 10% in September. The insurance companies in covering families in your community are split 50% BC/BS and 40% United Healthcare and no insurance (private pay). Your normal camper physical charge is $115. You give BC/BS an 18% discount and United Health care a 15% discount. The special promotion for campers without insurance (private pay) is $75. Camper Physical $ 115 Payor -…arrow_forward
- Give typing answer with explanation and conclusion What exactly is the DCR and how to lenders use it? Is there is a range they would find acceptable? In general, do they want it to be high or low? Why is that?arrow_forwardI need help with question 6 on how to create the customer pivot table as given. Also, can you provide the steps of how to do that in Excel? Also, please provide the steps in order to solve the problem for Finance.arrow_forwardFind the following values, using the equations, and then work the problems using a financial calculator to check your answers. Disregard rounding differences. (Hint: If you are using a financial calculator, you can enter the known values and then press the appropriate key to find the unknown variable. Then, without clearing the TVM register, you can "override" the variable that changes by simply entering a new value for it and then pressing the key for the unknown variable to obtain the second answer. This procedure can be used in parts b and d, and in many other situations, to see how changes in input variables affect the output variable.) Do not round intermediate calculations. Round your answers to the nearest cent. An initial $400 compounded for 1 year at 9.5%. $ An initial $400 compounded for 2 years at 9.5%. $ The present value of $400 due in 1 year at a discount rate of 9.5%. $ The present value of $400 due in 2 years at a discount rate of 9.5%. $arrow_forward
- Please let me know how I can find out whether something is premium or a discount. It would also be really helpful if you included the formula for both if there is one? Please answer the question in the picture I have attached another one with the completed chart in case it is needed.arrow_forwardYou have developed a self-study certification system for those who need credit hours for recertification by your state’s social welfare office. The system operates at virtually no cost, i.e., there is no marginal cost. A marketing research team has assembled the following sales information. You are researching the options for pricing the courses. Your goal is to achieve maximum revenue to establish funding to maintain and update the system to reflect annual policy changes in licensing requirements. Complete the calculations for Total Revenue by determining how many customers will purchase at each of the segment prices. Online Self Certifications for Social Work License Certification in Online Counseling Certification as a Group Home Counselor Bundle Customers TR Counseling TR Group Home TR Bundle Segment 1 1000 $190 a $70 e $260 4a Segment 2 1000 $150 b $90 f $240 4b…arrow_forwardYour company is evaluating two cloud-based secured data storage services. "Great Sky," the newer service, claims its uploading and downloading speeds are faster than the older service, "Clear and Steady Skies." You need to make a decision based on published access times for both services at different times and for varying file sizes. To make your decision, you purchase two statistical studies from which you discover the average download time for Great Sky is 0.67 sec. per MB and for Clear Steady Skies is 0.84. Additionally, the studies indicate the following sample information: NGS = 60 ncss = 50, SGS = 0.25 and scss = 0.55. Use a = .05, and the five step hypothesis testing procedure to make the appropriate decision.arrow_forward
- Select a current issue for which you can find background material. Become familiar with the issue and build a budget request that provides a solution to the issue. If a solution is already publicly available, work through the data so that you can re-create the budget request. Prepare a verbal briefing of no more than 10 minutes that reviews the background of the issue, identifies why it must be addressed, describes what your proposal will do to address the issue, and gives the amount of your budget request.arrow_forwardWhat are the steps to create a new estimate in QuickBooks Online? Projects > All Sales > New Transaction > Estimate Sales > Customers > New Customer Sales > All Sales > New Transaction > Estimate Gear icon > Estimatearrow_forwardFreeTaxUSA is an integrated software package used to complete tax returns for individuals and businesses. This week, you will use FreeTaxUSA to complete your critical thinking assignment. Thus, this is a great time to learn more about the software. Visit the site - www.freetaxusa.comLinks to an external site. and create a free account using your CSU Global email address. Review the site and share one item that you found interesting and may assist you in completing a tax return.arrow_forward
arrow_back_ios
SEE MORE QUESTIONS
arrow_forward_ios
Recommended textbooks for you
 Essentials Of Business AnalyticsStatisticsISBN:9781285187273Author:Camm, Jeff.Publisher:Cengage Learning,
Essentials Of Business Analytics
Statistics
ISBN:9781285187273
Author:Camm, Jeff.
Publisher:Cengage Learning,