
Videos
Predicting Land Value Both
a. Which do you think has a stronger relationship with value of the land—the number of acres of land or the number of rooms in the homes? Why?
b. If you were Dying to predict the value of a parcel of land (on which there is a home) in this area, would you be able to make a better pre-diction by knowing the acreage or the number of rooms in the house? Explain.
a.
Determine which one has stronger relationship with the value of land, the number of acres of land or the number of rooms.
Answer to Problem 1SE
The number of acres of land has a stronger relationship with the value of land.
Explanation of Solution
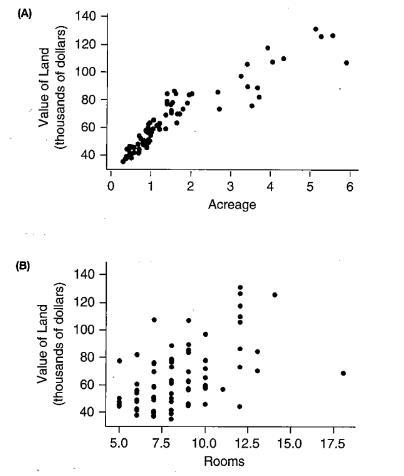
Scatterplot A shows the relationship between the value of land and number of acres of land that is provided. Scatterplot B shows the relationship between the value of land and number of rooms in the house that is given.
A scatterplot has less scattered data points and are forming a linear trend. Therefore, it can be said that there is a strong relationship between these two variables, number of acres of land and value of land.
The data points in the scatterplot output for B has more scattered data points and without forming any specific pattern and trend. It can be said that there isn’t a strong relationship between these two variables.
b.
Determine whether it is a good approach to make predictions for the value of a parcel of land by knowing the acreage or the number of rooms in the home.
Answer to Problem 1SE
Better prediction can be made by knowing the value of the acreage.
Explanation of Solution
Scatterplot A shows that the value of land has a stronger relationship with the acreage than the number of rooms in the house because there is less variability in the vertical direction. Changes made in the number of acres will affect the value of land more as compared to the number of rooms in the house.
Hence, the better prediction can be made by knowing the value of the acreage.
Want to see more full solutions like this?
Chapter 4 Solutions
Introductory Statistics (2nd Edition)


- Running In 1987, Canadian Ben Johnson set a world record in the 100-m sprint.The record was later taken away when he was found to have used an anabolic steroid to enhance his performance. His speed at various times in the race is given in the following table . Source: Information Graphics. Timesec Speedmph 0 0 1.84 12.9 3.80 23.8 6.38 26.3 7.23 26.3 8.96 26.0 9.83 25.7 a. Use the information in the table and left endpoints to estimate the distance that Johnson ran in miles. You will first need to calculate t for each interval. At the end, you will need to divide by 3600 the number of seconds in an hour, since the speed is in miles per hour. b. Repeat part a, using right endpoints. c. Wait a minute, we know that the distance Johnson ran is 100m. Divide this by 1609, the number of meters in a mile, to find how far Johnson ran in miles. Is your answer from part a or part b closer to the true answer? Briefly explain why you think this answer should be more accurate. d.arrow_forwardSports The ordered pairs below give the winning times (in seconds) of the women’s 100-meter freestyle in the Olympics from 1984 through 2012. 1984,55.92 2000,53.83 1988,54.93 2004,53.84 1992,54.64 2008,53.12 1996,54.50 2012,53.00 (a) Sketch a scatter plot of the data. Let y represent the winning time (in seconds) and let t=84 represent 1984. (b) Sketch the line that you think best approximates the data and find an equation of the line. (c) Use the regression feature of a graphing utility to find the equation of the least squares regression line that fits the data. (d) Compare the linear model you found in part (b) with the linear model you found in part (c).arrow_forwardOTHER APPLICATIONS Car Accidents The tables in the next columns give the death rates, per million person trips, for male and female drivers for various ages and number of passengers. Male Drivers Number of Passengers Age 0 1 2 3 16 2.61 4.39 6.29 9.08 17 1.63 2.77 4.61 6.92 30-59 0.92 0.75 0.62 0.54 Female Drivers Number of Passengers Age 0 1 2 3 16 1.38 1.72 1.94 3.31 17 1.26 1.48 2.82 2.28 30-59 0.41 0.33 0.27 0.40 a. Write a matrix for death rate of male drivers. b. Write a matrix for death rate of female drivers. c. Use the matrices from parts a and b to write a matrix showing the difference between the death rates of males and females. d. Analyze the results of part c and make some suggestions on how to reduce the rates.arrow_forward
 Calculus For The Life SciencesCalculusISBN:9780321964038Author:GREENWELL, Raymond N., RITCHEY, Nathan P., Lial, Margaret L.Publisher:Pearson Addison Wesley,
 Holt Mcdougal Larson Pre-algebra: Student Edition...AlgebraISBN:9780547587776Author:HOLT MCDOUGALPublisher:HOLT MCDOUGAL
 Glencoe Algebra 1, Student Edition, 9780079039897...AlgebraISBN:9780079039897Author:CarterPublisher:McGraw Hill
 Algebra & Trigonometry with Analytic GeometryAlgebraISBN:9781133382119Author:SwokowskiPublisher:Cengage
 Algebra: Structure And Method, Book 1AlgebraISBN:9780395977224Author:Richard G. Brown, Mary P. Dolciani, Robert H. Sorgenfrey, William L. ColePublisher:McDougal Littell