
Videos
Malnutrition and Poverty. R. Reifen et al. studied various nutritional measures of Ethiopian school children and published their findings in the paper “Ethiopian-Born and Native Israeli School Children Have Different Growth Patterns” (Nutrition, Vol. 19, pp. 427– 431). The study, conducted in Azezo, North West Ethiopia, found that malnutrition is prevalent in primary and secondary school children because of economic poverty. The weights, in kilograms (kg), of 60 randomly selected male Ethiopian-born school children aged 12– 15 years old are presented in increasing order in the following table.
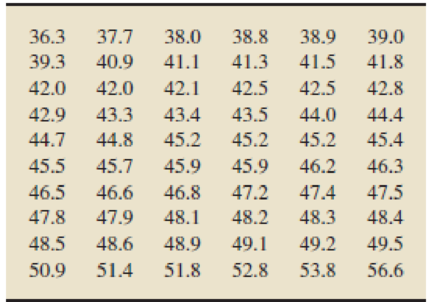
The sample
- a. Is it reasonable to apply the
empirical rule to estimate the percentages of observations that lie within one, two, and three standard deviations to either side of the mean? - b. Use the empirical rule to estimate the percentages of observations that lie within one, two, and three standard deviations to either side of the mean.
- c. Use the data to obtain the exact percentages of observations that lie within one, two, and three standard deviations to either side of the mean.
- d. Compare your answers in parts (b) and (c).

Learn your wayIncludes step-by-step video

Chapter 3 Solutions
Introductory Statistics (10th Edition)
Additional Math Textbook Solutions
Elementary Statistics: Picturing the World (6th Edition)
Statistical Reasoning for Everyday Life (5th Edition)
Introductory Statistics (2nd Edition)
Statistics for Psychology
Elementary Statistics Using Excel (6th Edition)
An Introduction to Mathematical Statistics and Its Applications (6th Edition)


- Urban Travel Times Population of cities and driving times are related, as shown in the accompanying table, which shows the 1960 population N, in thousands, for several cities, together with the average time T, in minutes, sent by residents driving to work. City Population N Driving time T Los Angeles 6489 16.8 Pittsburgh 1804 12.6 Washington 1808 14.3 Hutchinson 38 6.1 Nashville 347 10.8 Tallahassee 48 7.3 An analysis of these data, along with data from 17 other cities in the United States and Canada, led to a power model of average driving time as a function of population. a Construct a power model of driving time in minutes as a function of population measured in thousands b Is average driving time in Pittsburgh more or less than would be expected from its population? c If you wish to move to a smaller city to reduce your average driving time to work by 25, how much smaller should the city be?arrow_forwardIn a study by Dr. Harold J. Morowitz of Yale University, data were gathered that showed the relationship between the death rate of men and the average number of hours per day that the men slept. These data are listed in the following table:arrow_forwardA study published in JAMA in 2004 examined the past results of other studies on bariatric surgery. Bariatric surgery is done to replace the size of the stomach in various ways. It is typically used on only obese patients, and one the traditional form of the surgery, gastric bypass has a 1% mortality (death) rate caused by the surgery. However, in the studies reporting on the effects of this surgery on Type II diabetes, 1417 of 1846 diabetic patients recovered completely from diabetes after surgery. These patients no longer need medication like insulin (which is injected into the skin) or pills to help manage blood sugar. (a) What is the percentage of patients who recovered from diabetes in 2004?arrow_forward
- ) Which model is the better predictor based on the MSEarrow_forwardHeight and Breast Cancer. In the article “Height and Weight at Various Ages and Risk of Breast Cancer” (Annals of Epidemiology, Vol. 2, pp. 597–609), L. Brinton and C. Swanson discussed the relationship between height and breast cancer. The study, sponsored by the National Cancer Institute, took 5 years and involved more than 1500 women with breast cancer and 2000 women without breast cancer; it revealed a trend between height and breast cancer: “. . . taller women have a 50 to 80 percent greater risk of getting breast cancer than women who are closer to 5 feet tall.” Christine Swanson, a nutritionist who was involved with the study, added, “. . . height may be associated with the culprit, . . . but no one really knows” the exact relationship between height and the risk of breast cancer. a. Classify this study as either an observational study or a designed experiment. Explain your answer. b. Interpret the statement made by Christine Swanson in light of your answer to part (a).arrow_forwardAmong the literature on quitting smoking are data detailing the relative successfulness of people of different ages in quitting smoking. A study of 400 adults who began various smoking-cessation programs produced the data in the table below. In the table, each participant is classified according to two variables: length of their smoking cessation period ("Less than two weeks", "Between two weeks and one year", or "At least one year") and age ("21-34", or "35 and over"). In the table, "less than two weeks" means that the individual returned to smoking within two weeks of beginning the program; "between two weeks and one year" means that the individual lasted the first two weeks without smoking but retuned to smoking within a year; and "at least one year" means that the individual has not smoked for at least a year since beginning the program. The table is a contingency table whose cells contain the respective observed frequencies of classifications of the 400 smokers. In addition, three…arrow_forward
- Among the literature on quitting smoking are data detailing the relative successfulness of people of different ages in quitting smoking. A study of 400 adults who began various smoking-cessation programs produced the data in the table below. In the table, each participant is classified according to two variables: length of their smoking cessation period ("Less than two weeks", "Between two weeks and one year", or "At least one year") and age ("21-34", or "35 and over"). In the table, "less than two weeks" means that the individual returned to smoking within two weeks of beginning the program; "between two weeks and one year" means that the individual lasted the first two weeks without smoking but retuned to smoking within a year; and "at least one year" means that the individual has not smoked for at least a year since beginning the program. The table is a contingency table whose cells contain the respective observed frequencies of classifications of the 400 smokers. In addition, three…arrow_forwardThe article cited in Exercise 4 also investigated the effects of the factors on glucose consumption (in g/L). A single measurement is provided for each combination of factors (in the article, there was some replication). The results are presented in the following table. Glucose Consumption 68.0 -1 -1 -1 -1 -1 77.5 -1 -1 98.0 1. 1. -1 98.0 -1 -1 74.0 -1 77.0 -1 97.0 98.0 Compute estimates of the main effects and the interactions. a. Is it possible to compute an error sum of squares? Explain. Are any of the interactions among the larger effects? If so, which ones? d. Assume that it is known from past experience that the additive model holds. Add the sums of squares for the interactions, and use that result in place of an error sum of squares to test the hypotheses that the main effects are equal to 0. Ъ. C.arrow_forwardFifteen adult males between the ages of 35 and 50 participated in a study to evaluate the effect of diet and exercise on blood cholesterol levels. The total cholesterol was measured in each subject initially and then three months after participating in an aerobic exercise program and switching to a low-fat diet. The data are shown in the following table.arrow_forward
- A study published in JAMA in 2004 examined past results of other studies on bariatric surgery. Bariatric surgery is done to replace the size of the stomach in various ways. It is typically used on only obese patients, and one the traditional form of the surgery, gastric bypass has a 1% mortality (death) rate caused by the surgery. However, in the studies reporting on the effects of this surgery on Type II diabetes, 1417 of 1846 diabetic patients recovered completely from diabetes after surgery. These patients no longer need medication like insulin (which is injected into the skin) or pills to help manage blood sugar. (a) What is the percentage of patients who recovered from diabetes in 2004? (b) What is the 90%, 95% and 99% Confidence Interval for the percentage of recovery from diabetes (2004) data? (to four decimal places for the proportion - two decimal places if you give your answer as a percentage). In a study released a decade later, the percentage of patients who recover from…arrow_forwardA study published in JAMA in 2004 examined past results of other studies on bariatric surgery. Bariatric surgery is done to replace the size of the stomach in various ways. It is typically used on only obese patients, and one the traditional form of the surgery, gastric bypass has a 1% mortality (death) rate caused by the surgery. However, in the studies reporting on the effects of this surgery on Type II diabetes, 1417 of 1846 diabetic patients recovered completely from diabetes after surgery. These patients no longer need medication like insulin (which is injected into the skin) or pills to help manage blood sugar. In a study released a decade later, the percentage of patients who recover from diabetes has increased to 80%. W will determine whether this is a significant change from the 2004 data. The sample size in 2014 was 2000. (a) What is the percentage of patients who recovered from diabetes in 2014? What is the number of patients in the sample that have recovered? (b) What…arrow_forwardA study published in JAMA in 2004 examined past results of other studies on bariatric surgery. Bariatric surgery is done to replace the size of the stomach in various ways. It is typically used on only obese patients, and one the traditional form of the surgery, gastric bypass has a 1% mortality (death) rate caused by the surgery. However, in the studies reporting on the effects of this surgery on Type II diabetes, 1417 of 1846 diabetic patients recovered completely from diabetes after surgery. These patients no longer need medication like insulin (which is injected into the skin) or pills to help manage blood sugar. (a) What is the percentage of patients who recovered from diabetes in 2004? (b) What is the 90%, 95% and 99% Confidence Interval for the percentage of recovery from diabetes (2004) data? (to four decimal places for the proportion - two decimal places if you give your answer as a percentage).arrow_forward
 Functions and Change: A Modeling Approach to Coll...AlgebraISBN:9781337111348Author:Bruce Crauder, Benny Evans, Alan NoellPublisher:Cengage Learning
 Calculus For The Life SciencesCalculusISBN:9780321964038Author:GREENWELL, Raymond N., RITCHEY, Nathan P., Lial, Margaret L.Publisher:Pearson Addison Wesley,