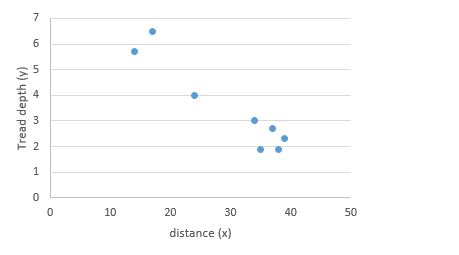
The following data provides the Tread Depth of a certain brand of tires of car after travelling thousands of kilometers: Distance 14 17 24 34 35 37 38 39 (x Thousand km) Tread Depth (y mm) (i) (ii) 5.7 6.5 4.0 3.0 1.9 2.7 1.9 2.3 Draw the scatter diagram for the above data Compute the correlation coefficient between Distance (x Thousand km) and Tread Depth( y mm) (iii) Find the equation of regression line of y on x using least square method.


Correlation
Correlation defines a relationship between two independent variables. It tells the degree to which variables move in relation to each other. When two sets of data are related to each other, there is a correlation between them.
Linear Correlation
A correlation is used to determine the relationships between numerical and categorical variables. In other words, it is an indicator of how things are connected to one another. The correlation analysis is the study of how variables are related.
Regression Analysis
Regression analysis is a statistical method in which it estimates the relationship between a dependent variable and one or more independent variable. In simple terms dependent variable is called as outcome variable and independent variable is called as predictors. Regression analysis is one of the methods to find the trends in data. The independent variable used in Regression analysis is named Predictor variable. It offers data of an associated dependent variable regarding a particular outcome.

i)
The scatter diagram for the data can be obtained using excel steps as follow:
- Enter the data into excel sheet.
- Select the data and go to insert>chart>scatter.
The diagram thus obtained as:
ii)
The correlation coefficient between distance and tread depth can be obtained using excel steps as follow:
- Enter the data into excel sheet.
- Use the formula =CORREL(select the data of distance (x), select the data of tread depth (y))
- Click Enter.
The correlation coefficient thus obtained as -0.951. There is strong negative correlation between variable x and y.

Step by step
Solved in 3 steps with 3 images


