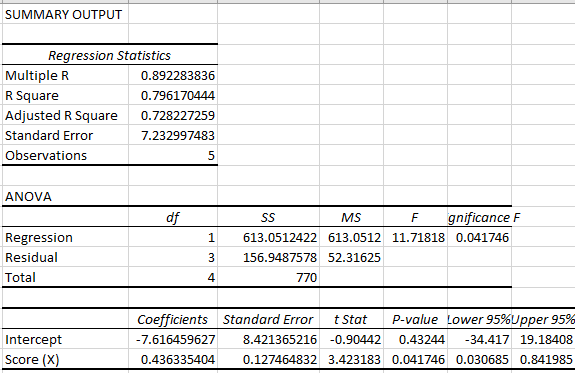
Prior to being hired, the ve salespersons for a computer store were given a standard sales aptitude test. For each individual, the score achieved on the aptitude test and the number of computer systems sold during the first 3 months of their employment are shown in the attached image. (a) Determine the least-squares regression line and interpret its slope. (b) Estimate, for a new employee who scores 60 on the sales aptitude test, the number of units the new employee will sell in her first 3 months with the company. (c) Find the standard error of estimate. (d) Find the r-square of the model.


Correlation
Correlation defines a relationship between two independent variables. It tells the degree to which variables move in relation to each other. When two sets of data are related to each other, there is a correlation between them.
Linear Correlation
A correlation is used to determine the relationships between numerical and categorical variables. In other words, it is an indicator of how things are connected to one another. The correlation analysis is the study of how variables are related.
Regression Analysis
Regression analysis is a statistical method in which it estimates the relationship between a dependent variable and one or more independent variable. In simple terms dependent variable is called as outcome variable and independent variable is called as predictors. Regression analysis is one of the methods to find the trends in data. The independent variable used in Regression analysis is named Predictor variable. It offers data of an associated dependent variable regarding a particular outcome.
1. Prior to being hired, the ve salespersons for a computer store were given a standard sales aptitude
test. For each individual, the score achieved on the aptitude test and the number of computer systems sold during the first 3 months of their employment are shown in the attached image.
(a) Determine the least-squares regression line and interpret its slope.
(b) Estimate, for a new employee who scores 60 on the sales aptitude test, the number of units the new employee will sell in her first 3 months with the company.
(c) Find the standard error of estimate.
(d) Find the r-square of the model.

Let Y be the Units sold in 3 months (dependent variable) and X be the score on aptitude test (independent variable)
Using Excel to fit a linear regression model as follows:
- Input the data in spreadsheet
- Go to Data tab > Data Analysis > Regression
- Input the range of values for Y and X
The following output is obtained:

Trending now
This is a popular solution!

Step by step
Solved in 2 steps with 1 images


