NATIONAL CENTER FOR CASE STUDY TEACHING IN SCIENCE Part II - Influenza in a Boarding School Note: The following questions require the use of the MS workbook "rabies_epidemiology_1.xlsx." That workbook contains two worksheets whose tabs are labelled "introduction" and "boarding school." Additional information and guidance is provided in Part II of the PowerPoint presentation associated with this case study. Questions Worksheet "boarding school," Slide 26: Days 1. Adjust ẞ (the transmission coefficient) and y (the recovery rate) until your prediction for the number of ill boys matches the real-world data well. The easiest way to do this is to click or click and hold on the space either side of the slider handle (for larger steps) or on the arrowheads framing the slider (for finer steps), rather than dragging the handle itself. 2. Report your values for ẞ and y, include a screenshot of your curve (crop it to show just the curve), and if you have done a least square analysis, report your sum of squares. Worksheet "boarding school," Slide 33: 3. From your values of ẞ and y, calculate the basic reproductive rate R, and the critical population size S, for influenza. NATIONAL CENTER FOR CASE STUDY TEACHING IN SCIENCE Part III - Modelling Rabies in Foxes Note: The following questions depend on the use of a second MS workbook, "rabies_epidemiology_2.xlsx." That workbook contains two worksheets whose tabs are labelled "fox rabies" and "with vaccination." Additional information and guidance is provided in Part III of the PowerPoint presentation associated with this case study. Start by looking closely at what is plotted in the graph on the worksheet "fox rabies," paying attention to which axis shows what. Then use the sliders to vary carrying capacity and latency. Observe how the patterns change and consider what they mean "in the real world." Questions Worksheet "fox rabies," Slide 43: 1. The model predicts different types of long-term outcomes for different combinations of latency periods (1/6) and carrying capacities K. Describe these outcomes for combinations of Kand (1/6) that fall within areas A, B and C of the plot (see Figure 1, right). Some extra help here: Adjust the sliders in the model so you arrive at combinations of latency periods 1/6 and carrying capacities K that lie in the regions A, B or C. Try to interpret what the curves for total and infectious populations mean. Predict what will happen in the long term by extrapolating the trend you see. Compare total population size at extrapolated "t=0" with the carrying capacity. Check R, to see if the disease spreads or comes to a halt. Fox carrying capacity K (km2) 10- C 10 20 !!!!!!!!! B A 30 Latency period 1/0 (days) Figure 1. Regions A, B, and C. 40 40 Worksheet "with vaccination," Slide 48: 2. For a range of carrying capacities from 0-10 km², find out "empirically" what minimum percentage of the population needs to be vaccinated to wipe out rabies. In a diagram, plot those points and indicate which is the "safe" area. (See Figure 2 for an illustration of the general idea; however, the actual plot will not look like this). 3. Considering that the density of foxes in Europe is in the range of 1-4 foxes km², what is your recommendation for how to eradicate rabies? 100% 50% % vaccination Safe 10 Carrying capacity K, foxes km² Figure 2. Sample figure for illustration only. 15
NATIONAL CENTER FOR CASE STUDY TEACHING IN SCIENCE Part II - Influenza in a Boarding School Note: The following questions require the use of the MS workbook "rabies_epidemiology_1.xlsx." That workbook contains two worksheets whose tabs are labelled "introduction" and "boarding school." Additional information and guidance is provided in Part II of the PowerPoint presentation associated with this case study. Questions Worksheet "boarding school," Slide 26: Days 1. Adjust ẞ (the transmission coefficient) and y (the recovery rate) until your prediction for the number of ill boys matches the real-world data well. The easiest way to do this is to click or click and hold on the space either side of the slider handle (for larger steps) or on the arrowheads framing the slider (for finer steps), rather than dragging the handle itself. 2. Report your values for ẞ and y, include a screenshot of your curve (crop it to show just the curve), and if you have done a least square analysis, report your sum of squares. Worksheet "boarding school," Slide 33: 3. From your values of ẞ and y, calculate the basic reproductive rate R, and the critical population size S, for influenza. NATIONAL CENTER FOR CASE STUDY TEACHING IN SCIENCE Part III - Modelling Rabies in Foxes Note: The following questions depend on the use of a second MS workbook, "rabies_epidemiology_2.xlsx." That workbook contains two worksheets whose tabs are labelled "fox rabies" and "with vaccination." Additional information and guidance is provided in Part III of the PowerPoint presentation associated with this case study. Start by looking closely at what is plotted in the graph on the worksheet "fox rabies," paying attention to which axis shows what. Then use the sliders to vary carrying capacity and latency. Observe how the patterns change and consider what they mean "in the real world." Questions Worksheet "fox rabies," Slide 43: 1. The model predicts different types of long-term outcomes for different combinations of latency periods (1/6) and carrying capacities K. Describe these outcomes for combinations of Kand (1/6) that fall within areas A, B and C of the plot (see Figure 1, right). Some extra help here: Adjust the sliders in the model so you arrive at combinations of latency periods 1/6 and carrying capacities K that lie in the regions A, B or C. Try to interpret what the curves for total and infectious populations mean. Predict what will happen in the long term by extrapolating the trend you see. Compare total population size at extrapolated "t=0" with the carrying capacity. Check R, to see if the disease spreads or comes to a halt. Fox carrying capacity K (km2) 10- C 10 20 !!!!!!!!! B A 30 Latency period 1/0 (days) Figure 1. Regions A, B, and C. 40 40 Worksheet "with vaccination," Slide 48: 2. For a range of carrying capacities from 0-10 km², find out "empirically" what minimum percentage of the population needs to be vaccinated to wipe out rabies. In a diagram, plot those points and indicate which is the "safe" area. (See Figure 2 for an illustration of the general idea; however, the actual plot will not look like this). 3. Considering that the density of foxes in Europe is in the range of 1-4 foxes km², what is your recommendation for how to eradicate rabies? 100% 50% % vaccination Safe 10 Carrying capacity K, foxes km² Figure 2. Sample figure for illustration only. 15

Case Studies In Health Information Management
3rd Edition
ISBN:9781337676908
Author:SCHNERING
Publisher:SCHNERING
Chapter7: Healthcare Statistics And Research Methods
Section: Chapter Questions
Problem 7.31.1C

Related questions
Question
Transcribed Image Text:NATIONAL CENTER FOR CASE STUDY TEACHING IN SCIENCE
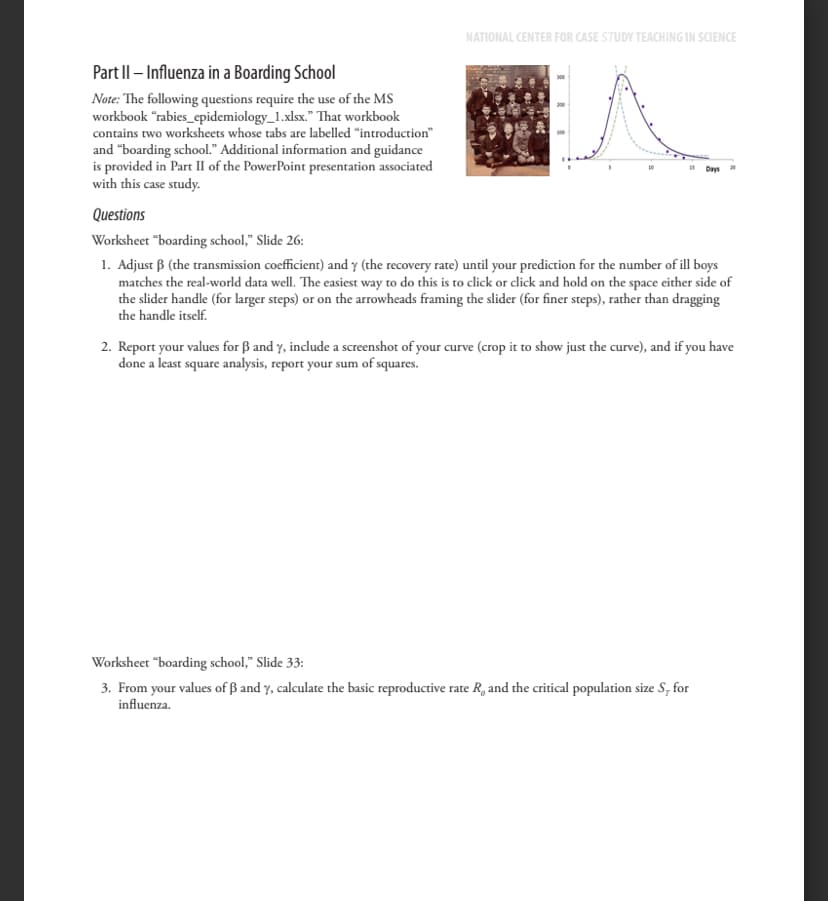
Part II - Influenza in a Boarding School
Note: The following questions require the use of the MS
workbook "rabies_epidemiology_1.xlsx." That workbook
contains two worksheets whose tabs are labelled "introduction"
and "boarding school." Additional information and guidance
is provided in Part II of the PowerPoint presentation associated
with this case study.
Questions
Worksheet "boarding school," Slide 26:
Days
1. Adjust ẞ (the transmission coefficient) and y (the recovery rate) until your prediction for the number of ill boys
matches the real-world data well. The easiest way to do this is to click or click and hold on the space either side of
the slider handle (for larger steps) or on the arrowheads framing the slider (for finer steps), rather than dragging
the handle itself.
2. Report your values for ẞ and y, include a screenshot of your curve (crop it to show just the curve), and if you have
done a least square analysis, report your sum of squares.
Worksheet "boarding school," Slide 33:
3. From your values of ẞ and y, calculate the basic reproductive rate R, and the critical population size S, for
influenza.
Transcribed Image Text:NATIONAL CENTER FOR CASE STUDY TEACHING IN SCIENCE
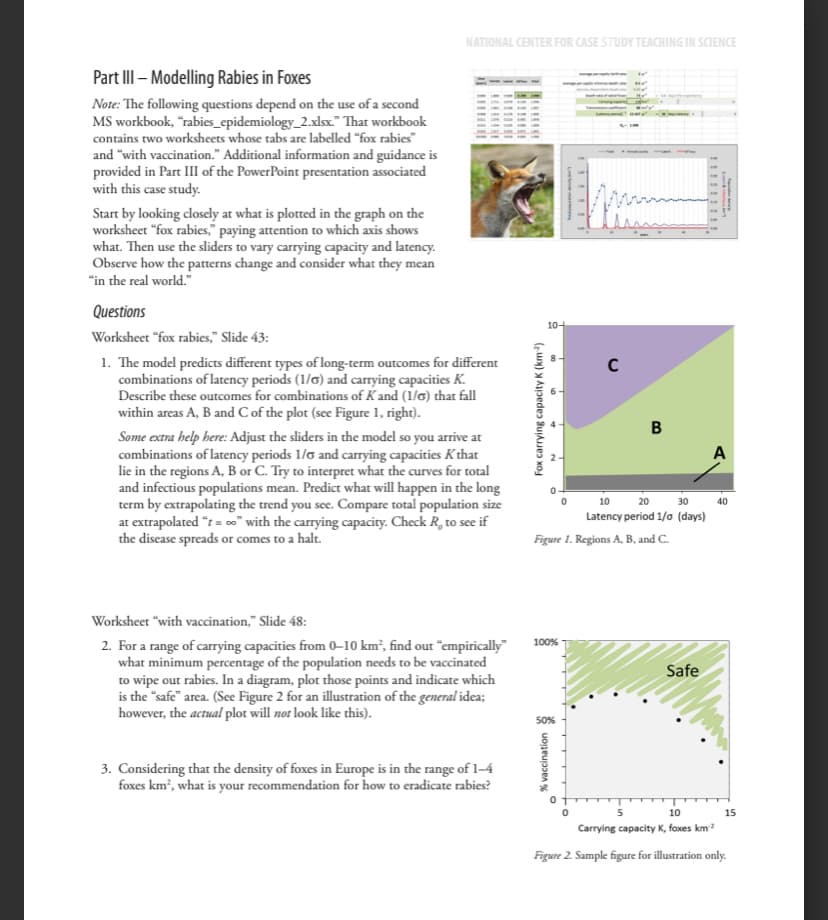
Part III - Modelling Rabies in Foxes
Note: The following questions depend on the use of a second
MS workbook, "rabies_epidemiology_2.xlsx." That workbook
contains two worksheets whose tabs are labelled "fox rabies"
and "with vaccination." Additional information and guidance is
provided in Part III of the PowerPoint presentation associated
with this case study.
Start by looking closely at what is plotted in the graph on the
worksheet "fox rabies," paying attention to which axis shows
what. Then use the sliders to vary carrying capacity and latency.
Observe how the patterns change and consider what they mean
"in the real world."
Questions
Worksheet "fox rabies," Slide 43:
1. The model predicts different types of long-term outcomes for different
combinations of latency periods (1/6) and carrying capacities K.
Describe these outcomes for combinations of Kand (1/6) that fall
within areas A, B and C of the plot (see Figure 1, right).
Some extra help here: Adjust the sliders in the model so you arrive at
combinations of latency periods 1/6 and carrying capacities K that
lie in the regions A, B or C. Try to interpret what the curves for total
and infectious populations mean. Predict what will happen in the long
term by extrapolating the trend you see. Compare total population size
at extrapolated "t=0" with the carrying capacity. Check R, to see if
the disease spreads or comes to a halt.
Fox carrying capacity K (km2)
10-
C
10
20
!!!!!!!!!
B
A
30
Latency period 1/0 (days)
Figure 1. Regions A, B, and C.
40
40
Worksheet "with vaccination," Slide 48:
2. For a range of carrying capacities from 0-10 km², find out "empirically"
what minimum percentage of the population needs to be vaccinated
to wipe out rabies. In a diagram, plot those points and indicate which
is the "safe" area. (See Figure 2 for an illustration of the general idea;
however, the actual plot will not look like this).
3. Considering that the density of foxes in Europe is in the range of 1-4
foxes km², what is your recommendation for how to eradicate rabies?
100%
50%
% vaccination
Safe
10
Carrying capacity K, foxes km²
Figure 2. Sample figure for illustration only.
15
Expert Solution
This question has been solved!
Explore an expertly crafted, step-by-step solution for a thorough understanding of key concepts.

Step by step
Solved in 1 steps

Recommended textbooks for you
Case Studies In Health Information Management
Biology
ISBN:
9781337676908
Author:
SCHNERING
Publisher:
Cengage

Comprehensive Medical Assisting: Administrative a…
Nursing
ISBN:
9781305964792
Author:
Wilburta Q. Lindh, Carol D. Tamparo, Barbara M. Dahl, Julie Morris, Cindy Correa
Publisher:
Cengage Learning
Case Studies In Health Information Management
Biology
ISBN:
9781337676908
Author:
SCHNERING
Publisher:
Cengage
Comprehensive Medical Assisting: Administrative a…
Nursing
ISBN:
9781305964792
Author:
Wilburta Q. Lindh, Carol D. Tamparo, Barbara M. Dahl, Julie Morris, Cindy Correa
Publisher:
Cengage Learning