he following data describes weekly gross revenue ($1000s), television advertising expenditures ($1000s), and newspaper advertising expenditures ($1000s) for Showtime Movie Theaters. TIT Weekly Gross Television Newspaper Advertising ($1000s) Revenue Advertising ($1000s) ($1000s) 99 5.0 1.5 90 2.0 2.0 95 4.0 1.5 92 2.5 2.5 95 3.0 3.3 94 3.5 2.3 94 2.5 4.2 94 3.0 2.5 .Find an estimated regression equation relating weekly gross revenue to television advertising expenditures and newspaper advertising expenditures (to 2 decimals). evenue = TVAdv + NewsAdv . Choose the correct plot of the standardized residuals against ŷ.


Unitary Method
The word “unitary” comes from the word “unit”, which means a single and complete entity. In this method, we find the value of a unit product from the given number of products, and then we solve for the other number of products.
Speed, Time, and Distance
Imagine you and 3 of your friends are planning to go to the playground at 6 in the evening. Your house is one mile away from the playground and one of your friends named Jim must start at 5 pm to reach the playground by walk. The other two friends are 3 miles away.
Profit and Loss
The amount earned or lost on the sale of one or more items is referred to as the profit or loss on that item.
Units and Measurements
Measurements and comparisons are the foundation of science and engineering. We, therefore, need rules that tell us how things are measured and compared. For these measurements and comparisons, we perform certain experiments, and we will need the experiments to set up the devices.
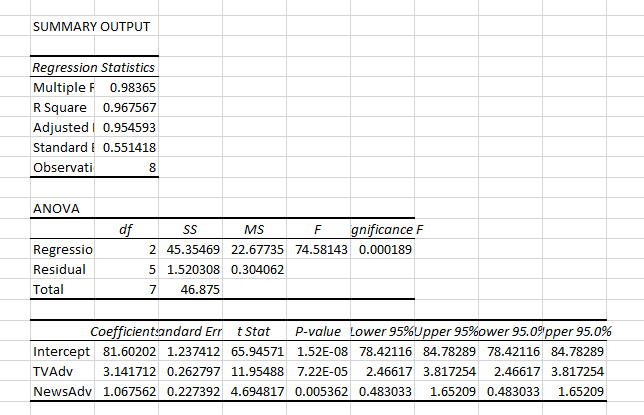
please assist with this NON GRADED problem.

a.
Step-by-step procedure to find the regression equation using Excel:
- In Excel sheet, enter Revenue in one column and enter TVAdv and NewsAdv in one column.
- In Data, select Data Analysis and choose Regression.
- In Input Variable y Range, select Revenue.
- In Input Variable x Range, select TVAdv and NewsAdv.
- Click Residuals and Residual Plot.
- Click Labels.
- Click Ok.
Output obtained using Excel is given below:

Trending now
This is a popular solution!

Step by step
Solved in 2 steps with 2 images


